
Description of Sea Surface Temperature:
Sea surface temperature (SST) is defined as the temperature of the top few millimeters of the ocean. This temperature directly or indirectly impacts the rate of all physical, chemical, and most biological processes occurring in the ocean. SST is globally monitored by sensors on satellites, buoys, ships, ocean reference stations, autonomous underwater vehicles (AUVs) and other technologies.
SST monitoring tells us how the ocean and atmosphere interact, as well as providing fundamental data on the global climate system. This information also aids us in weather prediction, i.e. identifying the onset of El Niño and La Niña cycles - multiyear shifts in atmospheric pressure and wind speeds. These shifts affect ocean circulation, global weather patterns, and marine ecosystems. SST anomalies have been linked to shifting marine resources. With warming temperatures, we observe the poleward movements of fish and other species. Temperature extremes—both ocean heatwaves and cold spells—have been linked to coral bleaching as well as fishery and aquaculture mortality. We present the annual average SST in all regions.
Check out our indicator highlight on SST and Marine heatwaves here.
Data:
The SST product used for this analysis is the NOAA Coral Reef Watch CoralTemp v3.1 SST composited monthly (https://coralreefwatch.noaa.gov/product/5km/index_5km_sst.php) accessed from CoastWatch (https://oceanwatch.pifsc.noaa.gov/erddap/griddap/CRW_sst_v3_1_monthly.g…) . Great Lakes SST data were accessed from (https://coastwatch.glerl.noaa.gov/glsea/glsea.html).
The data are plotted in degrees Celsius.
For the most up to date data, please reference the original source above.
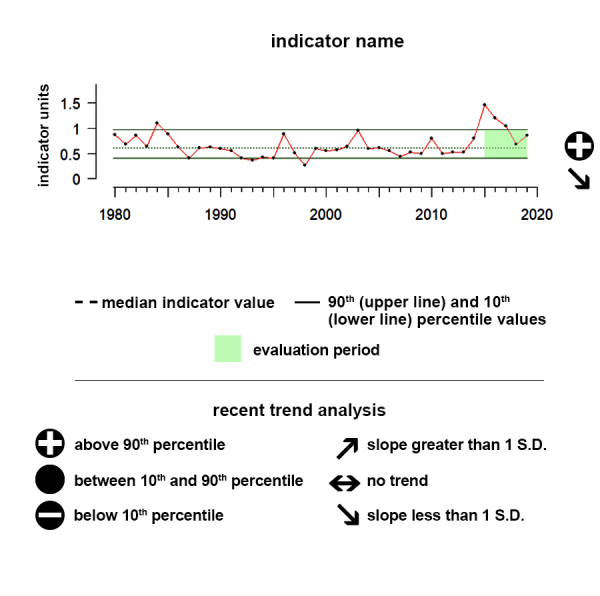
Understanding the Time series plots
Time series plots show the changes in each indicator as a function of time, over the period 1980-present. Each plot also shows horizontal lines that indicate the median (middle) value of that indicator, as well as the 10th and 90th percentiles, each calculated for the entire period of measurement. Time series plots were only developed for datasets with at least 10 years of data. Two symbols located to the right of each plot describe how recent values of an indicator compare against the overall series. A black circle indicates whether the indicator values over the last five years are on average above the series 90th percentile (plus sign), below the 10th percentile (minus sign), or between those two values (solid circle). Beneath that an arrow reflects the trend of the indicator over the last five years; an increase or decrease greater than one standard deviation is reflected in upward or downward arrows respectively, while a change of less than one standard deviation is recorded by a left-right arrow.

Hawaii SST
During the last five years there has been no significant trend but values were above the 90th percentile of all observed data in the time series.
Sea surface temperature is defined as the average temperature of the top few millimeters of the ocean. Sea surface temperature monitoring tells us how the ocean and atmosphere interact, as well as providing fundamental data on the global climate system
Data Interpretation:
Time series: The time series shows the integrated sea surface temperature for the Hawaiian Islands region. During the last five years there has been no significant trend but values were above the 90th percentile of all observed data in the time series.
Indicator and source information:
The SST product used for this analysis is the NOAA Coral Reef Watch CoralTemp v3.1 SST composited monthly (https://coralreefwatch.noaa.gov/product/5km/index_5km_sst.php) accessed from CoastWatch (https://oceanwatch.pifsc.noaa.gov/erddap/griddap/CRW_sst_v3_1_monthly.g…).
Great Lakes SST data were accessed from (https://coastwatch.glerl.noaa.gov/glsea/glsea.html).
The data are plotted in degrees Celsius.
Data background and limitations:
The NOAA Coral Reef Watch (CRW) daily global 5km Sea Surface Temperature (SST) product, also known as CoralTemp, shows the nighttime ocean temperature measured at the surface. The CoralTemp SST data product was developed from two, related reanalysis (reprocessed) SST products and a near real-time SST product. Monthly composites were used for this analysis.
California Current SST
During the last five years there has been no significant trend and values have remained within the 10th and 90th percentiles.
Sea surface temperature is defined as the average temperature of the top few millimeters of the ocean. Sea surface temperature monitoring tells us how the ocean and atmosphere interact, as well as providing fundamental data on the global climate system
Data Interpretation:
Time series: The time series shows the integrated sea surface temperature for the California Current region. During the last five years there has been no significant trend and values have remained within the 10th and 90th percentiles.
Indicator and source information:
The SST product used for this analysis is the NOAA Coral Reef Watch CoralTemp v3.1 SST composited monthly (https://coralreefwatch.noaa.gov/product/5km/index_5km_sst.php) accessed from CoastWatch (https://oceanwatch.pifsc.noaa.gov/erddap/griddap/CRW_sst_v3_1_monthly.g…).
Great Lakes SST data were accessed from (https://coastwatch.glerl.noaa.gov/glsea/glsea.html).
The data are plotted in degrees Celsius.
Data background and limitations:
The NOAA Coral Reef Watch (CRW) daily global 5km Sea Surface Temperature (SST) product, also known as CoralTemp, shows the nighttime ocean temperature measured at the surface. The CoralTemp SST data product was developed from two, related reanalysis (reprocessed) SST products and a near real-time SST product. Monthly composites were used for this analysis.
Gulf of America SST
During the last five years there has been a notable upward trend and values were above the 90th percentile of all observed data in the time series.
Sea surface temperature is defined as the average temperature of the top few millimeters of the ocean. Sea surface temperature monitoring tells us how the ocean and atmosphere interact, as well as providing fundamental data on the global climate system
Data Interpretation:
Time series: The time series shows the integrated sea surface temperature for the Gulf of America region. During the last five years there has been a notable upward trend and values were above the 90th percentile of all observed data in the time series.
Indicator and source information:
The SST product used for this analysis is the NOAA Coral Reef Watch CoralTemp v3.1 SST composited monthly (https://coralreefwatch.noaa.gov/product/5km/index_5km_sst.php) accessed from CoastWatch (https://oceanwatch.pifsc.noaa.gov/erddap/griddap/CRW_sst_v3_1_monthly.g…).
Great Lakes SST data were accessed from (https://coastwatch.glerl.noaa.gov/glsea/glsea.html).
The data are plotted in degrees Celsius.
Data background and limitations:
The NOAA Coral Reef Watch (CRW) daily global 5km Sea Surface Temperature (SST) product, also known as CoralTemp, shows the nighttime ocean temperature measured at the surface. The CoralTemp SST data product was developed from two, related reanalysis (reprocessed) SST products and a near real-time SST product. Monthly composites were used for this analysis.
US Caribbean SST
During the last five years there has been no notable trend and values were between the 10th and 90th percentiles of all observed data in the time series.
Sea surface temperature is defined as the average temperature of the top few millimeters of the ocean. Sea surface temperature monitoring tells us how the ocean and atmosphere interact, as well as providing fundamental data on the global climate system
Data Interpretation:
Time series: The time series shows the integrated sea surface temperature for the Caribbean region. During the last five years there has been no notable trend and values were between the 10th and 90th percentiles of all observed data in the time series.
Indicator and source information:
The SST product used for this analysis is the NOAA Coral Reef Watch CoralTemp v3.1 SST composited monthly (https://coralreefwatch.noaa.gov/product/5km/index_5km_sst.php) accessed from CoastWatch (https://oceanwatch.pifsc.noaa.gov/erddap/griddap/CRW_sst_v3_1_monthly.g…).
Great Lakes SST data were accessed from (https://coastwatch.glerl.noaa.gov/glsea/glsea.html).
The data are plotted in degrees Celsius.
Data background and limitations:
The NOAA Coral Reef Watch (CRW) daily global 5km Sea Surface Temperature (SST) product, also known as CoralTemp, shows the nighttime ocean temperature measured at the surface. The CoralTemp SST data product was developed from two, related reanalysis (reprocessed) SST products and a near real-time SST product. Monthly composites were used for this analysis.
Southeast SST
During the last five years there has been no notable trend but values have been above the 90th percentile of all observed data in the time series.
Sea surface temperature is defined as the average temperature of the top few millimeters of the ocean. Sea surface temperature monitoring tells us how the ocean and atmosphere interact, as well as providing fundamental data on the global climate system
Data Interpretation:
Time series: The time series shows the integrated sea surface temperature for the Southeast US region. During the last five years there has been no notable trend but values have been above the 90th percentile of all observed data in the time series.
Indicator and source information:
The SST product used for this analysis is the NOAA Coral Reef Watch CoralTemp v3.1 SST composited monthly (https://coralreefwatch.noaa.gov/product/5km/index_5km_sst.php) accessed from CoastWatch (https://oceanwatch.pifsc.noaa.gov/erddap/griddap/CRW_sst_v3_1_monthly.g…).
Great Lakes SST data were accessed from (https://coastwatch.glerl.noaa.gov/glsea/glsea.html).
The data are plotted in degrees Celsius.
Data background and limitations:
The NOAA Coral Reef Watch (CRW) daily global 5km Sea Surface Temperature (SST) product, also known as CoralTemp, shows the nighttime ocean temperature measured at the surface. The CoralTemp SST data product was developed from two, related reanalysis (reprocessed) SST products and a near real-time SST product. Monthly composites were used for this analysis.
Northeast SST
During the last five years there has been no significant trend and values have remained within the 10th and 90th percentiles of all observed data in the time series.
Sea surface temperature is defined as the average temperature of the top few millimeters of the ocean. Sea surface temperature monitoring tells us how the ocean and atmosphere interact, as well as providing fundamental data on the global climate system
Data Interpretation:
Time series: The time series shows the integrated sea surface temperature for the Northeast US region. During the last five years there has been no significant trend and values have remained within the 10th and 90th percentiles of all observed data in the time series.
Indicator and source information:
The SST product used for this analysis is the NOAA Coral Reef Watch CoralTemp v3.1 SST composited monthly (https://coralreefwatch.noaa.gov/product/5km/index_5km_sst.php) accessed from CoastWatch (https://oceanwatch.pifsc.noaa.gov/erddap/griddap/CRW_sst_v3_1_monthly.g…).
Great Lakes SST data were accessed from (https://coastwatch.glerl.noaa.gov/glsea/glsea.html).
The data are plotted in degrees Celsius.
Data background and limitations:
The NOAA Coral Reef Watch (CRW) daily global 5km Sea Surface Temperature (SST) product, also known as CoralTemp, shows the nighttime ocean temperature measured at the surface. The CoralTemp SST data product was developed from two, related reanalysis (reprocessed) SST products and a near real-time SST product. Monthly composites were used for this analysis.
Great Lakes SST
During the last five years there has been no notable trend and values were between the 10th and 90th percentile of all observed data in the time series.
Sea surface temperature is defined as the average temperature of the top few millimeters of the ocean. Sea surface temperature monitoring tells us how the ocean and atmosphere interact, as well as providing fundamental data on the global climate system.
Data Interpretation:
Time series: The time series shows the integrated sea surface temperature across the Great Lakes. During the last five years there has been no notable trend and values were between the 10th and 90th percentile of all observed data in the time series.
Description of Sea Surface Temperature:
Sea surface temperature (SST) is defined as the temperature of the top few millimeters of the ocean. This temperature directly or indirectly impacts the rate of all physical, chemical, and most biological processes occurring in the ocean. SST is globally monitored by sensors on satellites, buoys, ships, ocean reference stations, autonomous underwater vehicles (AUVs) and other technologies.
SST monitoring tells us how the ocean and atmosphere interact, as well as providing fundamental data on the global climate system. This information also aids us in weather prediction, i.e. identifying the onset of El Niño and La Niña cycles - multiyear shifts in atmospheric pressure and wind speeds. These shifts affect ocean circulation, global weather patterns, and marine ecosystems. SST anomalies have been linked to shifting marine resources. With warming temperatures, we observe the poleward movements of fish and other species. Temperature extremes—both ocean heatwaves and cold spells—have been linked to coral bleaching as well as fishery and aquaculture mortality. We present the annual average SST in all regions.
Data:
Great Lakes SST data were accessed from (https://coastwatch.glerl.noaa.gov/glsea/glsea.html).
The data are plotted in degrees Celsius.
Lake Ontario SST
During the last five years there has been a notable increasing trend and values were between the 10th and 90th percentile of all observed data in the time series.
Sea surface temperature is defined as the average temperature of the top few millimeters of the ocean. Sea surface temperature monitoring tells us how the ocean and atmosphere interact, as well as providing fundamental data on the global climate system.
Data Interpretation:
Time series: The time series shows the integrated sea surface temperature across Lake Ontario. During the last five years there has been a notable increasing trend and values were between the 10th and 90th percentile of all observed data in the time series.
Description of Sea Surface Temperature:
Sea surface temperature (SST) is defined as the temperature of the top few millimeters of the ocean. This temperature directly or indirectly impacts the rate of all physical, chemical, and most biological processes occurring in the ocean. SST is globally monitored by sensors on satellites, buoys, ships, ocean reference stations, autonomous underwater vehicles (AUVs) and other technologies.
SST monitoring tells us how the ocean and atmosphere interact, as well as providing fundamental data on the global climate system. This information also aids us in weather prediction, i.e. identifying the onset of El Niño and La Niña cycles - multiyear shifts in atmospheric pressure and wind speeds. These shifts affect ocean circulation, global weather patterns, and marine ecosystems. SST anomalies have been linked to shifting marine resources. With warming temperatures, we observe the poleward movements of fish and other species. Temperature extremes—both ocean heatwaves and cold spells—have been linked to coral bleaching as well as fishery and aquaculture mortality. We present the annual average SST in all regions.
Lake Ontario Description
Lake Ontario has a water surface area of 19,009 square kilometers or 7,340 square miles. In total 5.6 million people live along Lake Ontario with about 2.8 million residents from the United States and Canada each. From Lake Ontario, water leaves the Great Lakes Basin and ecosystem and flows to the Atlantic Ocean through the St. Lawrence River.
Data:
Great Lakes SST data were accessed from (https://coastwatch.glerl.noaa.gov/glsea/glsea.html).
The data are plotted in degrees Celsius.
Lake Erie SST
During the last five years there has been no notable trend and values were between the 10th and 90th percentile of all observed data in the time series.
Sea surface temperature is defined as the average temperature of the top few millimeters of the ocean. Sea surface temperature monitoring tells us how the ocean and atmosphere interact, as well as providing fundamental data on the global climate system.
Data Interpretation:
Time series: The time series shows the integrated sea surface temperature across Lake Erie. During the last five years there has been no notable trend and values were between the 10th and 90th percentile of all observed data in the time series.
Description of Sea Surface Temperature:
Sea surface temperature (SST) is defined as the temperature of the top few millimeters of the ocean. This temperature directly or indirectly impacts the rate of all physical, chemical, and most biological processes occurring in the ocean. SST is globally monitored by sensors on satellites, buoys, ships, ocean reference stations, autonomous underwater vehicles (AUVs) and other technologies.
SST monitoring tells us how the ocean and atmosphere interact, as well as providing fundamental data on the global climate system. This information also aids us in weather prediction, i.e. identifying the onset of El Niño and La Niña cycles - multiyear shifts in atmospheric pressure and wind speeds. These shifts affect ocean circulation, global weather patterns, and marine ecosystems. SST anomalies have been linked to shifting marine resources. With warming temperatures, we observe the poleward movements of fish and other species. Temperature extremes—both ocean heatwaves and cold spells—have been linked to coral bleaching as well as fishery and aquaculture mortality. We present the annual average SST in all regions.
Lake Erie Description
Lake Erie is the shallowest of the five Great Lakes with a maximum depth of 64 m or 210 ft. While only the fourth largest Great Lake with a water surface area of 25,655 square kilometers or 9,910 square miles. In the United States, about 10.5 million US residents live along Lake Erie and in Canada, roughly 1.9 million Canadians live near Lake Erie.
Data:
Great Lakes SST data were accessed from (https://coastwatch.glerl.noaa.gov/glsea/glsea.html).
The data are plotted in degrees Celsius.
Lake Huron SST
During the last five years there has been a notable upward trend and values were between the 10th and 90th percentile of all observed data in the time series.
Sea surface temperature is defined as the average temperature of the top few millimeters of the ocean. Sea surface temperature monitoring tells us how the ocean and atmosphere interact, as well as providing fundamental data on the global climate system.
Data Interpretation:
Time series: The time series shows the integrated sea surface temperature across Lake Huron. During the last five years there has been a notable upward trend and values were between the 10th and 90th percentile of all observed data in the time series.
Description of Sea Surface Temperature:
Sea surface temperature (SST) is defined as the temperature of the top few millimeters of the ocean. This temperature directly or indirectly impacts the rate of all physical, chemical, and most biological processes occurring in the ocean. SST is globally monitored by sensors on satellites, buoys, ships, ocean reference stations, autonomous underwater vehicles (AUVs) and other technologies.
SST monitoring tells us how the ocean and atmosphere interact, as well as providing fundamental data on the global climate system. This information also aids us in weather prediction, i.e. identifying the onset of El Niño and La Niña cycles - multiyear shifts in atmospheric pressure and wind speeds. These shifts affect ocean circulation, global weather patterns, and marine ecosystems. SST anomalies have been linked to shifting marine resources. With warming temperatures, we observe the poleward movements of fish and other species. Temperature extremes—both ocean heatwaves and cold spells—have been linked to coral bleaching as well as fishery and aquaculture mortality. We present the annual average SST in all regions.
Lake Huron Description
Lake Huron is the second largest Great Lake with a water surface area of 59,565 square kilometers or 23,000 square miles. About 1.5 million US residents and 1.5 million Canadians live along Lake Huron.
Data:
Great Lakes SST data were accessed from (https://coastwatch.glerl.noaa.gov/glsea/glsea.html).
The data are plotted in degrees Celsius.
Lake Michigan Surface Temperature
During the last five years there has been a notable increasing trend and values were between the 10th and 90th percentile of all observed data in the time series.
Sea surface temperature is defined as the average temperature of the top few millimeters of the ocean. Sea surface temperature monitoring tells us how the ocean and atmosphere interact, as well as providing fundamental data on the global climate system.
Data Interpretation:
Time series: The time series shows the integrated sea surface temperature across Lake Michigan. During the last five years there has been a notable increasing trend and values were between the 10th and 90th percentile of all observed data in the time series.
Description of Sea Surface Temperature:
Sea surface temperature (SST) is defined as the temperature of the top few millimeters of the ocean. This temperature directly or indirectly impacts the rate of all physical, chemical, and most biological processes occurring in the ocean. SST is globally monitored by sensors on satellites, buoys, ships, ocean reference stations, autonomous underwater vehicles (AUVs) and other technologies.
SST monitoring tells us how the ocean and atmosphere interact, as well as providing fundamental data on the global climate system. This information also aids us in weather prediction, i.e. identifying the onset of El Niño and La Niña cycles - multiyear shifts in atmospheric pressure and wind speeds. These shifts affect ocean circulation, global weather patterns, and marine ecosystems. SST anomalies have been linked to shifting marine resources. With warming temperatures, we observe the poleward movements of fish and other species. Temperature extremes—both ocean heatwaves and cold spells—have been linked to coral bleaching as well as fishery and aquaculture mortality. We present the annual average SST in all regions.
Lake Michigan Description
Lake Michigan is the third largest Great Lake and has a water surface area of 57,573 square kilometers or 22,300 square miles. Unlike the other four Great Lakes, Lake Michigan is entirely within the United States. Roughly 12 million people live along the shores of Lake Michigan. (While Lakes Michigan and Huron are often referred to as two separate lakes, technically they are one hydrologic system connected by the Straits of Mackinac.)
Data:
Great Lakes SST data were accessed from (https://coastwatch.glerl.noaa.gov/glsea/glsea.html).
The data are plotted in degrees Celsius.
Lake Superior SST
During the last five years there has been an no notable trend and values were between the 10th and 90th percentile of all observed data in the time series.
Sea surface temperature is defined as the average temperature of the top few millimeters of the ocean. Sea surface temperature monitoring tells us how the ocean and atmosphere interact, as well as providing fundamental data on the global climate system.
Data Interpretation:
Time series: The time series shows the integrated sea surface temperature across Lake Superior. During the last five years there has been an no notable trend and values were between the 10th and 90th percentile of all observed data in the time series.
Description of Sea Surface Temperature:
Sea surface temperature (SST) is defined as the temperature of the top few millimeters of the ocean. This temperature directly or indirectly impacts the rate of all physical, chemical, and most biological processes occurring in the ocean. SST is globally monitored by sensors on satellites, buoys, ships, ocean reference stations, autonomous underwater vehicles (AUVs) and other technologies.
SST monitoring tells us how the ocean and atmosphere interact, as well as providing fundamental data on the global climate system. This information also aids us in weather prediction, i.e. identifying the onset of El Niño and La Niña cycles - multiyear shifts in atmospheric pressure and wind speeds. These shifts affect ocean circulation, global weather patterns, and marine ecosystems. SST anomalies have been linked to shifting marine resources. With warming temperatures, we observe the poleward movements of fish and other species. Temperature extremes—both ocean heatwaves and cold spells—have been linked to coral bleaching as well as fishery and aquaculture mortality. We present the annual average SST in all regions.
Lake Superior Description
Lake Superior is the second largest lake in the world by surface area, and is the largest and deepest of the five Great Lakes. Lake Superior reaches depths up to 406 m or 1,333 ft. Extending through Canada and the United States, about 444,000 US residents and 229,000 Canadian residents live along the shores of Lake Superior. Lake Superior flows into Lake Huron through the St. Marys River.
Alaska SST
During the last five years there has been a significant downward trend and values have remained within the 10th and 90th percentiles of all observed data in the time series.
The time series shows the integrated sea surface temperature for the Alaska region. During the last five years there has been a significant downward trend and values have remained within the 10th and 90th percentiles of all observed data in the time series.
Indicator and source information:
The SST product used for this analysis is the NOAA Coral Reef Watch CoralTemp v3.1 SST composited monthly (https://coralreefwatch.noaa.gov/product/5km/index_5km_sst.php) accessed from CoastWatch (https://oceanwatch.pifsc.noaa.gov/erddap/griddap/CRW_sst_v3_1_monthly.g…).
Great Lakes SST data were accessed from (https://coastwatch.glerl.noaa.gov/glsea/glsea.html).
The data are plotted in degrees Celsius.
Data background and limitations:
The NOAA Coral Reef Watch (CRW) daily global 5km Sea Surface Temperature (SST) product, also known as CoralTemp, shows the nighttime ocean temperature measured at the surface. The CoralTemp SST data product was developed from two, related reanalysis (reprocessed) SST products and a near real-time SST product. Spanning January 1, 1985 to the present, the CoralTemp SST is one of the best and most internally consistent daily global 5km SST products available. Monthly composites were used for this analysis.
Documentation: https://coralreefwatch.noaa.gov/product/5km/index_5km_sst.php
Resources
NOAA Coral Reef Watch
NOAA established the Coral Reef Watch (CRW) program in 2000. For more than 20 years, NOAA CRW has utilized remote sensing, modeled and in situ data to observe, predict, and report to its users on the coral reef environment worldwide. CRW provides the only global early-warning system of coral reef ecosystem physical environmental changes. Its near real-time satellite products and modeled Outlook predictions have successfully and accurately monitored and predicted all major mass coral bleaching events observed globally since 1997, while also providing other critical information to users, especially during times of high oceanic heat stress. CRW's products help resource managers, scientists, decision makers (including elected officials), monitoring networks, and the public monitor climate impacts to reef ecosystems worldwide; better understand links between environmental conditions and ecosystem impacts; assess when reefs are vulnerable or resilient to climate change and its impacts (especially bleaching); and prepare and prioritize resources to implement timely, effective protective responses and adaptation actions (including restoration efforts), thereby improving the management and regulation of coral reefs in a warming world. Protective measures include reducing local stressors in times of high heat stress (e.g., by closing major scuba diving and fishing areas). CRW also informs multiple national and international assessments of coral reef conditions.

Sea Surface Temperature - NOAA CoastWatch
NOAA CoastWatch/OceanWatch provides easy access for everyone to global and regional satellite data products for use in understanding, managing and protecting ocean and coastal resources and for assessing impacts of environmental change in ecosystems, weather, and climate.
Great Lakes SST CoastWatch
The CoastWatch node at GLERL provides clients including Federal, state, and local agencies, academic institutions, commercial/industries and the public, both within and outside of the Great Lakes region, with access to near real-time satellite observations and in-situ data for the Great Lakes. CoastWatch data are used in a variety of ways, including near real-time observation and tracking of algal blooms, plumes, ice cover, wind, water intake temperatures at fish hatcheries, two and three dimensional modeling of Great Lakes physical parameters such as wave height and currents damage assessment modeling, research, and educational and recreational activities. In addition, through a cooperative project with Michigan Sea Grant, Great Lakes CoastWatch satellite-derived surface temperature imagery is contoured and made available via Michigan State Sea Grant’s web site. Great Lakes CoastWatch data and products benefit riparians as well as commercial and recreational users.
IOOS and Bio-TT
The 34 IOOS Core Variables: Ocean observing measurements required to detect and predict changes in the ocean

Global Climate Indicators
The Global Climate Indicators are a set of parameters that describe the changing climate without reducing climate change to only temperature. They comprise key information for the most relevant domains of climate change: temperature and energy, atmospheric composition, ocean, and water as well as the cryosphere.

GOOS Essential Ocean Variables
The ocean environment is vast, remote, and harsh, and the cost involved in its observation are high. There is a need to avoid duplication of efforts, across observing platforms and networks, and to adopt common standards for data collection and dissemination to maximize the utility of data. To address these concerns, the Framework is designed to approach ocean observations with a focus on Essential Ocean Variables, ensuring assessments that cut across platforms and recommend the best, most cost effective plan to provide an optimal global view for each EOV.

Climate Change Indicators in the US (4th Edition)
EPA partners with more than 40 data contributors from various government agencies, academic institutions, and other organizations to compile a key set of indicators related to the causes and effects of climate change. The indicators are published in EPA's report, Climate Change Indicators in the United States, available on this website and in print. Explore the indicators below.

U.S. Global Change Research Program
Indicators are observations or calculations that can be used to track conditions and trends. Indicators related to climate—which may be physical, ecological, or societal—can be used to understand how environmental conditions are changing, assess risks and vulnerabilities, and help inform resiliency and planning for climate impacts.

Sea Surface Temperature - Map Viewer - Climate Prediction Center GIS Portal
NOAA Climate.gov provides science and information for a climate-smart nation. Americans’ health, security, and economic well-being are closely linked to climate and weather. People want and need information to help them make decisions on how to manage climate-related risks and opportunities they face.
NOAA Climate.gov is a source of timely and authoritative scientific data and information about climate. Our goals are to promote public understanding of climate science and climate-related events, to make our data products and services easy to access and use, to provide climate-related support to the private sector and the Nation’s economy, and to serve people making climate-related decisions with tools and resources that help them answer specific questions.

Sea Surface Temperature (SST) Contour Charts - Office of Satellite and Product Operations
The Office of Satellite and Product Operations (OSPO) manages and directs the operation of the central ground facilities which ingest, process, and distribute environmental satellite data and derived products to domestic and foreign users.
Marine/Ocean Data - NCEI
NCEI receives and archives meteorological data from ships at sea, moored and drifting buoys, coastal stations, rigs, and platforms. The temporal frequency of the observations range from sub-hourly to six-hourly synoptic and are global in spatial coverage.