
Description of Ecosystem Overfishing:
Fishing is an activity that produces important economic, cultural, and nutritional benefits and in many regions it remains a major contributor to food security. If too much of a fish population is removed, these benefits erode over time. Traditionally we have monitored individual populations of single fish species to determine if a population is being caught at too high of a level (that is, it experiences overfishing), but sometimes multiple fish species are caught at high levels within an ecosystem. We have begun to monitor entire ecosystems to keep track of overfishing of the entire fish community. We currently monitor overfishing for each stock in a community at the stock level; what this is doing is now looking at all of those stocks together. Ecosystem overfishing is an ecological, and not legal, term that ultimately evaluates how much fish are caught in an ecosystem relative to how much can be produced. The Ryther index, shown here, is an example of an ecosystem overfishing indicator. The Ryther Index is defined by Link and Watson (2019) as total catch per unit area in the ecosystem and represents an advanced way to detect the total removal of fish biomass by area in a Large Marine Ecosystem relative to how much that entire ecosystem can produce. In general terms, the lower the Ryther index, the less likely an ecosystem will be experiencing ecosystem overfishing.
Data Source:
Commercial and Recreational landings in metric tons were downloaded from the National Marine Fisheries Service’s annual fisheries landings query tool which can be found here. Total amount of fish landed generated were aggregated to the appropriate region, and Index scores were calculated using the methods identified in Link and Watson, 2019. The Ryther index is composed of total catch presented on a unit area basis for an ecosystem. Per Link and Watson, 2019, “the Ryther index should probably be on the order of 0.3 to 1.1 t km−2 year−1 or practically not to exceed (NTE) ~1 t km−2 year−1, with an extreme limit NTE 3 t km−2 year−1.” The area of each ecosystem was calculated from NOAA/UN values from IWNet.
For the most up to date data, please reference the original source above.
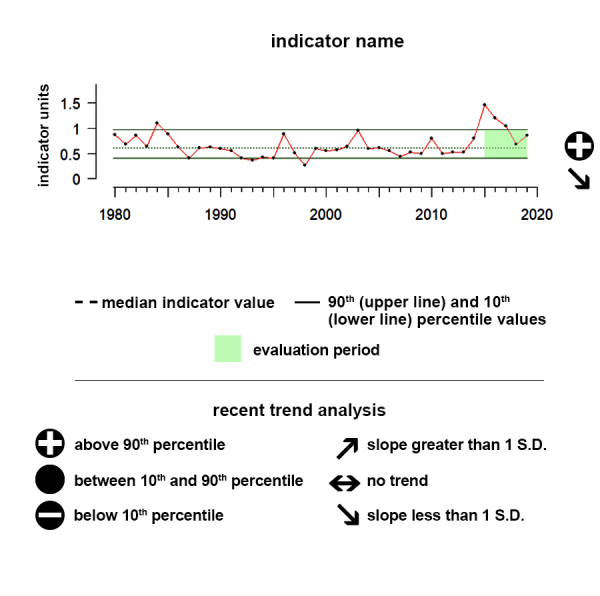
Understanding the Time series plots
Time series plots show the changes in each indicator as a function of time, over the period 1980-present. Each plot also shows horizontal lines that indicate the median (middle) value of that indicator, as well as the 10th and 90th percentiles, each calculated for the entire period of measurement. Time series plots were only developed for datasets with at least 10 years of data. Two symbols located to the right of each plot describe how recent values of an indicator compare against the overall series. A black circle indicates whether the indicator values over the last five years are on average above the series 90th percentile (plus sign), below the 10th percentile (minus sign), or between those two values (solid circle). Beneath that an arrow reflects the trend of the indicator over the last five years; an increase or decrease greater than one standard deviation is reflected in upward or downward arrows respectively, while a change of less than one standard deviation is recorded by a left-right arrow.

Alaska Ryther Index
Between 2016 and 2021, the Ryther Index in Alaska was similar to historic levels and there is no recent trend apparent.
Values correspond to Ryther Index values
Data Interpretation:
Ecosystem Overfishing Time Series
Between 2016 and 2021, the Ryther Index in Alaska was similar to historic levels and there is no recent trend apparent.
Indicator Source Information:
Landings are reported in tons of round (live) weight for all species or groups except univalve and bivalve mollusks, such as clams, mussels, oysters and scallops, which are reported as weight of meats (excludes shell weight). Landings data may sometimes differ from state-reported landings due to our reporting of mollusks in meat weights rather than gallons, shell weight, or bushels. Also, NMFS includes some species such as kelp and oysters that are sometimes reported by state agricultural agencies and may not be included with state fishery agency landings data.
Data Background and Caveats:
All landings summaries used in the compilation of this indicator only include non-confidential data. Federal statutes prohibit public disclosure of landings (or other information) that would allow identification of the data contributors and possibly put them at a competitive disadvantage. Most summarized landings here are non-confidential, but whenever confidential landings occur they have been combined with other landings and usually reported as "Withheld for Confidentiality" Total landings by state include confidential data and will be accurate, but landings reported by individual species may, in some instances, be misleading due to data confidentiality, which would be minimal given the aggregated nature of how these data were combined.
Landings data do not indicate the physical location of harvest but the location at which the landings either first crossed the dock or were reported from, as associated with major regions in the US
Many fishery products are gutted or otherwise processed while at sea and are landed in a product type other than round (whole) weight. Our data partners have standard conversion factors for the majority of the commonly caught species that convert their landing weights from any product type to whole weight. It is the whole weight that is displayed in our web site landing statistics. Caution should be exercised when using these statistics. An example of a potential problem is when landings statistics are used to monitor fishery quotas. In some situations, specific conversion factors may have been designated in fishery management plans or Federal rule making that differ from those historically used by NOAA Fisheries in reporting landings statistics.
Landings do not include aquaculture products except for clams, mussels and oysters.
Pacific landings summarized by state include an artificial “state” designation of “At-Sea Process, Pac.” This designation was assigned to landings consisting of primarily whiting caught in the EEZ off Washington and Oregon that were processed aboard large vessels while at sea. No Pacific state lists these fish on their trip tickets which are used to report state fishery landing, hence the at-sea processor designation was used to insure that they would be listed as a U.S. landing.
Landing summaries are compiled from data bases that overlap in time and geographic coverage, and come from both within and outside of NOAA Fisheries.
Ecosystem overfishing metrics also have potential thresholds, usually for the Ryther Index of approximately 1; but we do not report Ryther index values here relative to any threshold. Rather, we report the value of the indices for each region relative to their time series values. Comparison to some regional reports may slightly differ due to the inclusion or exclusion of specific species, but the same general trends are observed and align.
Hawai'i Ryther Index
The Ryther Index in Hawai’i between 2016 and 2021 was similar to historical patterns, with no recent trend apparent.
Values correspond to Ryther Index values
Data Interpretation:
Ecosystem Overfishing Time Series
The Ryther Index in Hawai’i between 2016 and 2021 was similar to historical patterns, with no recent trend apparent.
Indicator Source Information:
Landings are reported in tons of round (live) weight for all species or groups except univalve and bivalve mollusks, such as clams, mussels, oysters and scallops, which are reported as weight of meats (excludes shell weight). Landings data may sometimes differ from state-reported landings due to our reporting of mollusks in meat weights rather than gallons, shell weight, or bushels. Also, NMFS includes some species such as kelp and oysters that are sometimes reported by state agricultural agencies and may not be included with state fishery agency landings data.
Data Background and Caveats:
All landings summaries used in the compilation of this indicator only include non-confidential data. Federal statutes prohibit public disclosure of landings (or other information) that would allow identification of the data contributors and possibly put them at a competitive disadvantage. Most summarized landings here are non-confidential, but whenever confidential landings occur they have been combined with other landings and usually reported as "Withheld for Confidentiality" Total landings by state include confidential data and will be accurate, but landings reported by individual species may, in some instances, be misleading due to data confidentiality, which would be minimal given the aggregated nature of how these data were combined.
Landings data do not indicate the physical location of harvest but the location at which the landings either first crossed the dock or were reported from, as associated with major regions in the US
Many fishery products are gutted or otherwise processed while at sea and are landed in a product type other than round (whole) weight. Our data partners have standard conversion factors for the majority of the commonly caught species that convert their landing weights from any product type to whole weight. It is the whole weight that is displayed in our web site landing statistics. Caution should be exercised when using these statistics. An example of a potential problem is when landings statistics are used to monitor fishery quotas. In some situations, specific conversion factors may have been designated in fishery management plans or Federal rule making that differ from those historically used by NOAA Fisheries in reporting landings statistics.
Landings do not include aquaculture products except for clams, mussels and oysters.
Pacific landings summarized by state include an artificial “state” designation of “At-Sea Process, Pac.” This designation was assigned to landings consisting of primarily whiting caught in the EEZ off Washington and Oregon that were processed aboard large vessels while at sea. No Pacific state lists these fish on their trip tickets which are used to report state fishery landing, hence the at-sea processor designation was used to insure that they would be listed as a U.S. landing.
Landing summaries are compiled from data bases that overlap in time and geographic coverage, and come from both within and outside of NOAA Fisheries.
Ecosystem overfishing metrics also have potential thresholds, usually for the Ryther Index of approximately 1; but we do not report Ryther index values here relative to any threshold. Rather, we report the value of the indices for each region relative to their time series values. Comparison to some regional reports may slightly differ due to the inclusion or exclusion of specific species, but the same general trends are observed and align.
California Current Ryther Index
The Ryther Index in the California Current ecosystem between 2016 and 2021 was substantially lower than historical patterns, though there is no trend in values.
Values correspond to Ryther Index values
Data Interpretation:
Ecosystem Overfishing Time Series
The Ryther Index in the California Current ecosystem between 2016 and 2021 was substantially lower than historical patterns, though there is no trend in values.
Indicator Source Information:
Landings are reported in tons of round (live) weight for all species or groups except univalve and bivalve mollusks, such as clams, mussels, oysters and scallops, which are reported as weight of meats (excludes shell weight). Landings data may sometimes differ from state-reported landings due to our reporting of mollusks in meat weights rather than gallons, shell weight, or bushels. Also, NMFS includes some species such as kelp and oysters that are sometimes reported by state agricultural agencies and may not be included with state fishery agency landings data.
Data Background and Caveats:
All landings summaries used in the compilation of this indicator only include non-confidential data. Federal statutes prohibit public disclosure of landings (or other information) that would allow identification of the data contributors and possibly put them at a competitive disadvantage. Most summarized landings here are non-confidential, but whenever confidential landings occur they have been combined with other landings and usually reported as "Withheld for Confidentiality" Total landings by state include confidential data and will be accurate, but landings reported by individual species may, in some instances, be misleading due to data confidentiality, which would be minimal given the aggregated nature of how these data were combined.
Landings data do not indicate the physical location of harvest but the location at which the landings either first crossed the dock or were reported from, as associated with major regions in the US
Many fishery products are gutted or otherwise processed while at sea and are landed in a product type other than round (whole) weight. Our data partners have standard conversion factors for the majority of the commonly caught species that convert their landing weights from any product type to whole weight. It is the whole weight that is displayed in our web site landing statistics. Caution should be exercised when using these statistics. An example of a potential problem is when landings statistics are used to monitor fishery quotas. In some situations, specific conversion factors may have been designated in fishery management plans or Federal rule making that differ from those historically used by NOAA Fisheries in reporting landings statistics.
Landings do not include aquaculture products except for clams, mussels and oysters.
Pacific landings summarized by state include an artificial “state” designation of “At-Sea Process, Pac.” This designation was assigned to landings consisting of primarily whiting caught in the EEZ off Washington and Oregon that were processed aboard large vessels while at sea. No Pacific state lists these fish on their trip tickets which are used to report state fishery landing, hence the at-sea processor designation was used to insure that they would be listed as a U.S. landing.
Landing summaries are compiled from data bases that overlap in time and geographic coverage, and come from both within and outside of NOAA Fisheries.
Ecosystem overfishing metrics also have potential thresholds, usually for the Ryther Index of approximately 1; but we do not report Ryther index values here relative to any threshold. Rather, we report the value of the indices for each region relative to their time series values. Comparison to some regional reports may slightly differ due to the inclusion or exclusion of specific species, but the same general trends are observed and align.
Gulf of America Ryther Index
Between 2016 and 2021, average annual Ryther Index values in the Gulf of America were similar to historical patterns, and there is no trend in values.
Values correspond to Ryther Index values
Data Interpretation:
Ecosystem Overfishing Time Series
Between 2016 and 2021, average annual Ryther Index values in the Gulf of America were similar to historical patterns, and there is no trend in values.
Indicator Source Information:
Landings are reported in tons of round (live) weight for all species or groups except univalve and bivalve mollusks, such as clams, mussels, oysters and scallops, which are reported as weight of meats (excludes shell weight). Landings data may sometimes differ from state-reported landings due to our reporting of mollusks in meat weights rather than gallons, shell weight, or bushels. Also, NMFS includes some species such as kelp and oysters that are sometimes reported by state agricultural agencies and may not be included with state fishery agency landings data.
Data Background and Caveats:
All landings summaries used in the compilation of this indicator only include non-confidential data. Federal statutes prohibit public disclosure of landings (or other information) that would allow identification of the data contributors and possibly put them at a competitive disadvantage. Most summarized landings here are non-confidential, but whenever confidential landings occur they have been combined with other landings and usually reported as "Withheld for Confidentiality" Total landings by state include confidential data and will be accurate, but landings reported by individual species may, in some instances, be misleading due to data confidentiality, which would be minimal given the aggregated nature of how these data were combined.
Landings data do not indicate the physical location of harvest but the location at which the landings either first crossed the dock or were reported from, as associated with major regions in the US
Many fishery products are gutted or otherwise processed while at sea and are landed in a product type other than round (whole) weight. Our data partners have standard conversion factors for the majority of the commonly caught species that convert their landing weights from any product type to whole weight. It is the whole weight that is displayed in our web site landing statistics. Caution should be exercised when using these statistics. An example of a potential problem is when landings statistics are used to monitor fishery quotas. In some situations, specific conversion factors may have been designated in fishery management plans or Federal rule making that differ from those historically used by NOAA Fisheries in reporting landings statistics.
Landings do not include aquaculture products except for clams, mussels and oysters.
Pacific landings summarized by state include an artificial “state” designation of “At-Sea Process, Pac.” This designation was assigned to landings consisting of primarily whiting caught in the EEZ off Washington and Oregon that were processed aboard large vessels while at sea. No Pacific state lists these fish on their trip tickets which are used to report state fishery landing, hence the at-sea processor designation was used to insure that they would be listed as a U.S. landing.
Landing summaries are compiled from data bases that overlap in time and geographic coverage, and come from both within and outside of NOAA Fisheries.
Ecosystem overfishing metrics also have potential thresholds, usually for the Ryther Index of approximately 1; but we do not report Ryther index values here relative to any threshold. Rather, we report the value of the indices for each region relative to their time series values. Comparison to some regional reports may slightly differ due to the inclusion or exclusion of specific species, but the same general trends are observed and align.
Southeast Ryther Index
Between 2016 and 2021, average annual Ryther Index values from the Southeast were similar to historical patterns, and there is no trend in values.
Values correspond to Ryther Index values
Data Interpretation:
Ecosystem Overfishing Time Series
Between 2016 and 2021, average annual Ryther Index values from the Southeast were similar to historical patterns, and there is no trend in values.
Indicator Source Information:
Landings are reported in tons of round (live) weight for all species or groups except univalve and bivalve mollusks, such as clams, mussels, oysters and scallops, which are reported as weight of meats (excludes shell weight). Landings data may sometimes differ from state-reported landings due to our reporting of mollusks in meat weights rather than gallons, shell weight, or bushels. Also, NMFS includes some species such as kelp and oysters that are sometimes reported by state agricultural agencies and may not be included with state fishery agency landings data.
Data Background and Caveats:
All landings summaries used in the compilation of this indicator only include non-confidential data. Federal statutes prohibit public disclosure of landings (or other information) that would allow identification of the data contributors and possibly put them at a competitive disadvantage. Most summarized landings here are non-confidential, but whenever confidential landings occur they have been combined with other landings and usually reported as "Withheld for Confidentiality" Total landings by state include confidential data and will be accurate, but landings reported by individual species may, in some instances, be misleading due to data confidentiality, which would be minimal given the aggregated nature of how these data were combined.
Landings data do not indicate the physical location of harvest but the location at which the landings either first crossed the dock or were reported from, as associated with major regions in the US
Many fishery products are gutted or otherwise processed while at sea and are landed in a product type other than round (whole) weight. Our data partners have standard conversion factors for the majority of the commonly caught species that convert their landing weights from any product type to whole weight. It is the whole weight that is displayed in our web site landing statistics. Caution should be exercised when using these statistics. An example of a potential problem is when landings statistics are used to monitor fishery quotas. In some situations, specific conversion factors may have been designated in fishery management plans or Federal rule making that differ from those historically used by NOAA Fisheries in reporting landings statistics.
Landings do not include aquaculture products except for clams, mussels and oysters.
Pacific landings summarized by state include an artificial “state” designation of “At-Sea Process, Pac.” This designation was assigned to landings consisting of primarily whiting caught in the EEZ off Washington and Oregon that were processed aboard large vessels while at sea. No Pacific state lists these fish on their trip tickets which are used to report state fishery landing, hence the at-sea processor designation was used to insure that they would be listed as a U.S. landing.
Landing summaries are compiled from data bases that overlap in time and geographic coverage, and come from both within and outside of NOAA Fisheries.
Ecosystem overfishing metrics also have potential thresholds, usually for the Ryther Index of approximately 1; but we do not report Ryther index values here relative to any threshold. Rather, we report the value of the indices for each region relative to their time series values. Comparison to some regional reports may slightly differ due to the inclusion or exclusion of specific species, but the same general trends are observed and align.
Northeast Ryther Index
Between 2016 and 2021, average annual Ryther Index values from the Northeast were substantially lower than historical patterns, although there is no trend in values.
Values correspond to Ryther Index values
Data Interpretation:
Ecosystem Overfishing Time Series
Between 2016 and 2021, average annual Ryther Index values from the Northeast were substantially lower than historical patterns, although there is no trend in values.
Indicator Source Information:
Landings are reported in tons of round (live) weight for all species or groups except univalve and bivalve mollusks, such as clams, mussels, oysters and scallops, which are reported as weight of meats (excludes shell weight). Landings data may sometimes differ from state-reported landings due to our reporting of mollusks in meat weights rather than gallons, shell weight, or bushels. Also, NMFS includes some species such as kelp and oysters that are sometimes reported by state agricultural agencies and may not be included with state fishery agency landings data.
Data Background and Caveats:
All landings summaries used in the compilation of this indicator only include non-confidential data. Federal statutes prohibit public disclosure of landings (or other information) that would allow identification of the data contributors and possibly put them at a competitive disadvantage. Most summarized landings here are non-confidential, but whenever confidential landings occur they have been combined with other landings and usually reported as "Withheld for Confidentiality" Total landings by state include confidential data and will be accurate, but landings reported by individual species may, in some instances, be misleading due to data confidentiality, which would be minimal given the aggregated nature of how these data were combined.
Landings data do not indicate the physical location of harvest but the location at which the landings either first crossed the dock or were reported from, as associated with major regions in the US
Many fishery products are gutted or otherwise processed while at sea and are landed in a product type other than round (whole) weight. Our data partners have standard conversion factors for the majority of the commonly caught species that convert their landing weights from any product type to whole weight. It is the whole weight that is displayed in our web site landing statistics. Caution should be exercised when using these statistics. An example of a potential problem is when landings statistics are used to monitor fishery quotas. In some situations, specific conversion factors may have been designated in fishery management plans or Federal rule making that differ from those historically used by NOAA Fisheries in reporting landings statistics.
Landings do not include aquaculture products except for clams, mussels and oysters.
Pacific landings summarized by state include an artificial “state” designation of “At-Sea Process, Pac.” This designation was assigned to landings consisting of primarily whiting caught in the EEZ off Washington and Oregon that were processed aboard large vessels while at sea. No Pacific state lists these fish on their trip tickets which are used to report state fishery landing, hence the at-sea processor designation was used to insure that they would be listed as a U.S. landing.
Landing summaries are compiled from data bases that overlap in time and geographic coverage, and come from both within and outside of NOAA Fisheries.
Ecosystem overfishing metrics also have potential thresholds, usually for the Ryther Index of approximately 1; but we do not report Ryther index values here relative to any threshold. Rather, we report the value of the indices for each region relative to their time series values. Comparison to some regional reports may slightly differ due to the inclusion or exclusion of specific species, but the same general trends are observed and align.
Additional Resources
NOAA FOSS Database
There are multiple Fisheries Information Networks (FINs) that serve as regional, co-operative, state-federal programs to design, implement and conduct marine fisheries statistics data collection programs. These FINs and partners all collect and store commercial and recreational fish landings data in disparate regional databases. FOSS provides a centralized, web-accessible, database-driven query tool that can be used to generate dynamic reports on U.S. commercial and recreational fisheries landings.
Global ecosystem overfishing: Clear delineation within real limits to production
Peer-Reviewed Publication that introduces and defines the Ryther Index.

Evidence of ecosystem overfishing in U.S. large marine ecosystems
Marine capture fisheries in the U.S. are important from a societal, cultural, economic, and ecological perspective. Although fisheries in the U.S. are generally well-managed, they still face some challenges as do most fisheries around the world. To address these challenges, a broader, more systematic approach is useful. There is a global need to develop measures of ecosystem overfishing (EOF) that detect overfishing of an entire ecosystem using readily available data and based on widely repeatable patterns. These EOF indicators extend the thinking beyond single stock overfishing to an entire ecosystem and are largely based on well-established trophic theory.