
Description of Sea Ice Extent:
Unlike icebergs, glaciers, ice sheets, and ice shelves, which originate on land, sea ice forms, expands, and melts in the ocean. Sea ice influences global climate by reflecting sunlight back into space. In winter, incoming solar energy is not absorbed into the ocean because of the sea ice coverage resulting in temperatures remaining cool. In summer, when sea ice melts, the surface area reflecting sunlight decreases, allowing more solar energy to be absorbed by the ocean, causing temperatures to rise. This creates a positive feedback loop. Warmer water temperatures delay ice growth in the autumn and winter, and the ice melts faster the following spring, exposing ocean waters for longer periods the following summer.
Sea ice is an important element of the Arctic and Antarctic systems. For example, sea ice in the Arctic provides an important habitat for biological activity, e.g. algae grows on the bottom of sea ice, forming the basis of the Arctic food web. It also plays a critical role in the life cycle of many marine mammals such as seals and polar bears. Sea ice also serves a critical role in supporting the culture—and even survival—of Indigenous communities. We present the annual sea ice extent in millions of kilometers for the Arctic region.
Additionally, understanding the major effect of ice on the Great Lakes is crucial because it impacts a range of societal benefits provided by the lakes, from hydropower generation to commercial shipping to the fishing industry. The amount of ice cover varies from year to year, as well as how long it remains on the lakes. NOAA scientists are observing long-term changes in ice cover as a result of global warming. Studying, monitoring, and predicting ice coverage on the Great Lakes plays an important role in determining climate patterns, lake water levels, water movement patterns, water temperature structure, and spring plankton blooms. We present the annual maximum lake ice as a percentage of surface area for the Great Lakes region
Data Source:
Sea ice data was accessed from the NOAA National Centers for Environmental Information (NCEI) for the northern hemisphere. The data are plotted in units of millions of square km.
Great Lakes ice data was accessed from the NOAA Great Lakes Environmental Research Laboratory, Original ice charts from 1973 through 1988 are from the Canadian Ice Service. Beginning in 1989, the source was the U.S. National Ice Center (USNIC). Currently, data from both Canadian and U.S. sources are combined in USNIC's daily products. The data are plotted as a percentage of total lake surface area
For the most up to date data, please reference the original source above.
Understanding the Time series plots
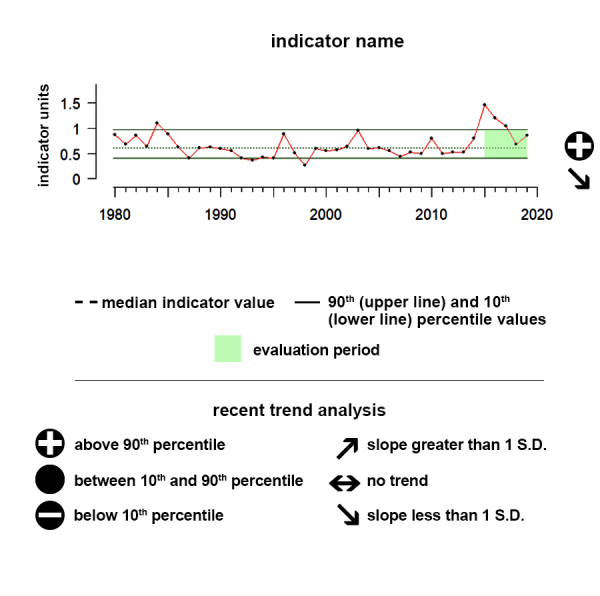
Time series plots show the changes in each indicator as a function of time, over the period 1980-present. Each plot also shows horizontal lines that indicate the median (middle) value of that indicator, as well as the 10th and 90th percentiles, each calculated for the entire period of measurement. Time series plots were only developed for datasets with at least 10 years of data. Two symbols located to the right of each plot describe how recent values of an indicator compare against the overall series. A black circle indicates whether the indicator values over the last five years are on average above the series 90th percentile (plus sign), below the 10th percentile (minus sign), or between those two values (solid circle). Beneath that an arrow reflects the trend of the indicator over the last five years; an increase or decrease greater than one standard deviation is reflected in upward or downward arrows respectively, while a change of less than one standard deviation is recorded by a left-right arrow.

Alaska Arctic Ice
During the last five years, there has been no notable trend and values are within the 10th and 90th percentiles, albeit near the lower end of the time series.
Sea ice is an important element of the Arctic system. We present the annual Arctic sea ice extent in units of millions of square kilometers.
Data Interpretation:
This time series shows the sea ice extent for the Alaska-Arctic region from 1979 to 2024. During the last five years, there has been no notable trend and values are within the 10th and 90th percentiles, albeit near the lower end of the time series.
Indicator and source information:
Sea ice is ice that forms, expands, and melts in the ocean. Sea ice has an important effect on Earth’s heat balance by reflecting solar energy back to space; it also plays a role in determining ocean salinity and currents, and it provides important habitat for many marine organisms.
The time series shows the Sea Ice extent in September of each year to give a sense of the summertime (i.e., minimum annual) extent through the years of sea ice across the entire Northern Hemisphere, which includes the Arctic Ocean and the Hudson Bay.
Data background and limitations:
Sea ice figures and data was accessed from NOAA NCEI for the northern hemisphere, https://www.ncei.noaa.gov/access/monitoring/snow-and-ice-extent/ The data are plotted in units of millions of square km.
Close
Lake Ontario Ice
During the last five years, there has been no notable trend and values are within the 10th and 90th percentiles.
Values correspond to annual maximum percentage of total lake surface area of lake ice cover
Data Interpretation:
This time series shows the sea ice extent for Lake Ontario from 1979 to 2024. During the last five years, there has been no notable trend and values are within the 10th and 90th percentiles.
Indicator and source information:
The time series shows the lake ice extent for Lake Ontario for each winter. The annual maximum extent as percentage of total lake surface area between December and May of each winter season in the Great Lakes region.
Data background and limitations:
Great Lakes ice data was accessed from the NOAA Great Lakes Environmental Research Laboratory, https://www.glerl.noaa.gov/data/ice. Original ice charts from 1973 through 1988 are from the Canadian Ice Service. Beginning in 1989, the source was the U.S. National Ice Center (USNIC). Currently, data from both Canadian and U.S. sources are combined in USNIC's daily products. The data are plotted as a percentage of total lake surface area.
Lake Erie Ice
During the last five years, there has been no notable trend and values are within the 10th and 90th percentiles.
Values correspond to annual maximum percentage of total lake surface area of lake ice cover
Data Interpretation:
This time series shows the sea ice extent for Lake Erie from 1979 to 2024. During the last five years, there has been no notable trend and values are within the 10th and 90th percentiles.
Indicator and source information:
The time series shows the lake ice extent for Lake Erie for each winter. The annual maximum extent as percentage of total lake surface area between December and May of each winter season in the Great Lakes region.
Data background and limitations:
Great Lakes ice data was accessed from the NOAA Great Lakes Environmental Research Laboratory, https://www.glerl.noaa.gov/data/ice. Original ice charts from 1973 through 1988 are from the Canadian Ice Service. Beginning in 1989, the source was the U.S. National Ice Center (USNIC). Currently, data from both Canadian and U.S. sources are combined in USNIC's daily products. The data are plotted as a percentage of total lake surface area.
Lake Huron Ice
During the last five years, there has been a decreasing trend and values are within the 10th and 90th percentiles.
Values correspond to annual maximum percentage of total lake surface area of lake ice cover
Data Interpretation:
This time series shows the sea ice extent for Lake Huon from 1979 to 2024. During the last five years, there has been a decreasing trend and values are within the 10th and 90th percentiles.
Indicator and source information:
The time series shows the lake ice extent for Lake Huron for each winter. The annual maximum extent as percentage of total lake surface area between December and May of each winter season in the Great Lakes region.
Data background and limitations:
Great Lakes ice data was accessed from the NOAA Great Lakes Environmental Research Laboratory, https://www.glerl.noaa.gov/data/ice. Original ice charts from 1973 through 1988 are from the Canadian Ice Service. Beginning in 1989, the source was the U.S. National Ice Center (USNIC). Currently, data from both Canadian and U.S. sources are combined in USNIC's daily products. The data are plotted as a percentage of total lake surface area.
Lake Michigan Ice
During the last five years, there has been no notable trend and values are within the 10th and 90th percentiles.
Values correspond to annual maximum percentage of total lake surface area of lake ice cover
Data Interpretation:
This time series shows the sea ice extent for Lake Michigan from 1979 to 2024. During the last five years, there has been no notable trend and values are within the 10th and 90th percentiles.
Indicator and source information:
The time series shows the lake ice extent for Lake Michigan for each winter. The annual maximum extent as percentage of total lake surface area between December and May of each winter season in the Great Lakes region.
Data background and limitations:
Great Lakes ice data was accessed from the NOAA Great Lakes Environmental Research Laboratory, https://www.glerl.noaa.gov/data/ice. Original ice charts from 1973 through 1988 are from the Canadian Ice Service. Beginning in 1989, the source was the U.S. National Ice Center (USNIC). Currently, data from both Canadian and U.S. sources are combined in USNIC's daily products. The data are plotted as a percentage of total lake surface area.
Lake Superior Ice
During the last five years, there has been a decreasing trend and values are within the 10th and 90th percentiles.
Values correspond to annual maximum percentage of total lake surface area of lake ice cover
Data Interpretation:
This time series shows the sea ice extent for Lake Michigan from 1979 to 2024. During the last five years, there has been a decreasing trend and values are within the 10th and 90th percentiles.
Indicator and source information:
The time series shows the lake ice extent for Lake Superior for each winter. The annual maximum extent as percentage of total lake surface area between December and May of each winter season in the Great Lakes region.
Data background and limitations:
Great Lakes ice data was accessed from the NOAA Great Lakes Environmental Research Laboratory, https://www.glerl.noaa.gov/data/ice. Original ice charts from 1973 through 1988 are from the Canadian Ice Service. Beginning in 1989, the source was the U.S. National Ice Center (USNIC). Currently, data from both Canadian and U.S. sources are combined in USNIC's daily products. The data are plotted as a percentage of total lake surface area.
Resources
National Snow and Ice Data Center (NSIDC) Sea Ice and Snow Cover Extent
Sea ice extent provided by the National Snow and Ice Data Center (NSIDC) is available from 1979–2020 for the Northern Hemisphere, Southern Hemisphere, and Globe. Snow cover extent provided by the Rutgers University Global Snow Laboratory (GSL) is available from 1967–2020 for the North America + Greenland, Northern Hemisphere, Eurasia, and North America. All anomalies are relative to the 1981–2010 average.

Alaska IEA Conditions Report (Bering Sea)
Ecosystem Status Reports are produced annually to compile and summarize information about the status of the Alaska marine ecosystems for the North Pacific Fishery Management Council, the scientific community and the public. As of 2016, there are separate reports for the the Eastern Bering Sea (updated 2019), Aleutian Islands (updated 2018), the Gulf of Alaska (updated 2019), and Arctic (forthcoming) ecosystems. These reports include ecosystem report cards, ecosystem assessments, and ecosystem and ecosystem-based management indicators that together provide context for ecosystem-based fisheries management in Alaska.

NOAA Arctic Report Card
Tracking recent environmental changes relative to historical records

Climate Change Indicators in the US (4th Edition)
EPA partners with more than 40 data contributors from various government agencies, academic institutions, and other organizations to compile a key set of indicators related to the causes and effects of climate change. The indicators are published in EPA's report, Climate Change Indicators in the United States, available on this website and in print. Explore the indicators below.

NOAA Arctic Program
NOAA provides science, service, and stewardship to the rapidly changing Arctic region, its inhabitants, and the nation.

Alaska Region Sea Ice Forecasts
National Weather Service Alaska Sea Ice Program products and tools.