
Description of overfished stocks:
An overfished stock is a population of fish that is too low. A stock that is experiencing overfishing has an annual rate of catch that is too high. Therefore the population cannot support that level of fishing and is below that level is deemed “overfished.” A fish population can be “overfished” as the result of many factors, including overfishing, as well as habitat degradation, pollution, climate change, and disease. The Magnuson-Stevens Act mandates that overfished stocks and stocks experiencing overfishing be reported annually. Stock status is determined by NOAA, based on the results of stock assessments.
To understand the abundance and distribution of fish populations, NOAA regularly assesses fish stocks through stock assessments. Stock assessments provide the information necessary for NOAA to make determinations that a stock is experiencing overfishing (harvest higher than a maximum sustainable yield) or is overfished (population size is too low such that it jeopardizes supporting the maximum sustainable yield). If a stock becomes overfished, stock assessments can help determine what steps may be taken to rebuild it to sustainable levels, including the appropriate reduction in fishing rates.
It is important to track whether a fish population is overfished or experiencing overfishing because fish play an important role in marine ecosystems. Fish support the ecological structure of many marine food webs. Caught by recreational and commercial fisheries, fish support significant parts of coastal economies, and can play an important cultural role in many regions.
This site presents the number of overfished stocks by year in all regions.
Data Source:
Data were obtained from the NOAA Fisheries Fishery Stock Status website. Stocks that met the criteria for overfished status were summed by year for each region.
For the most up to date data, please reference the original source linked above.
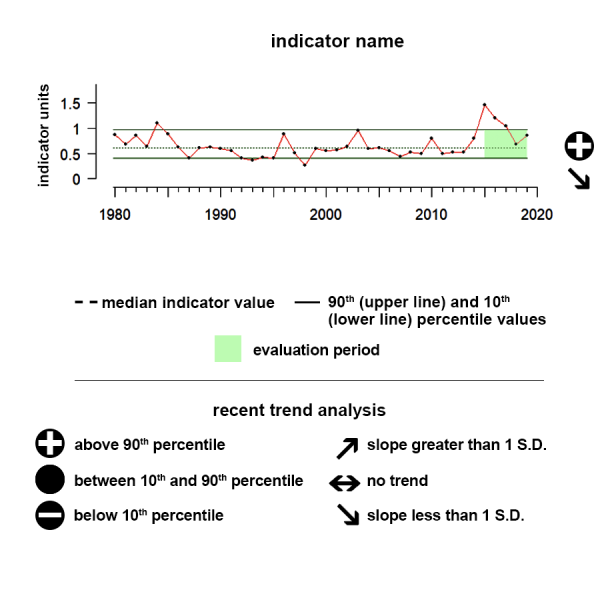
Understanding the Time series plots
Time series plots show the changes in each indicator as a function of time, over the period 1980-present. Each plot also shows horizontal lines that indicate the median (middle) value of that indicator, as well as the 10th and 90th percentiles, each calculated for the entire period of measurement. Time series plots were only developed for datasets with at least 10 years of data. Two symbols located to the right of each plot describe how recent values of an indicator compare against the overall series. A black circle indicates whether the indicator values over the last five years are on average above the series 90th percentile (plus sign), below the 10th percentile (minus sign), or between those two values (solid circle). Beneath that an arrow reflects the trend of the indicator over the last five years; an increase or decrease greater than one standard deviation is reflected in upward or downward arrows respectively, while a change of less than one standard deviation is recorded by a left-right arrow.
Alaska Overfished Stocks
Between 2020 and 2025 the number of overfished stocks showed an upward trend.
The x-axis represents years. The y-axis represents the number of fish stocks or fish populations that are deemed by NOAA as overfished. Overfished means the population of fish is too low. Therefore the population cannot support a large amount of fishing.
Description of time series:
The series shows the number of fish populations that have been listed as overfished since 2000. Between 2020 and 2025 the number of overfished stocks showed an upward trend.
Description of Overfished stocks:
An overfished stock is a population of fish that is too low. A stock that is experiencing overfishing has an annual rate of catch that is too high. Therefore the population cannot support that level of fishing and is below that level is deemed “overfished.” A fish population can be “overfished” as the result of many factors, including overfishing, as well as habitat degradation, pollution, climate change, and disease. The Magnuson-Stevens Act mandates that overfished stocks and stocks experiencing overfishing be reported annually. Stock status is determined by NOAA, based on the results of stock assessments.
Data Source:
Data were obtained from the NOAA Fisheries Fishery Stock Status website. Stocks that met the criteria for overfished status were summed by year for each region.
Main Hawaiian Islands Overfished Stocks
Between 2020 and 2025 the number of overfished stocks shows no trend.
The x-axis represents years. The y-axis represents the number of fish stocks or fish populations that are deemed by NOAA as overfished. Overfished means the population of fish is too low. Therefore the population cannot support a large amount of fishing. This indicator does not count Pacific Island-specific complexes.
Description of time series:
The series shows the number of fish populations that have been listed as overfished since 2000. Between 2020 and 2025 the number of overfished stocks shows no trend.
Description of Overfished stocks:
An overfished stock is a population of fish that is too low. A stock that is experiencing overfishing has an annual rate of catch that is too high. Therefore the population cannot support that level of fishing and is below that level is deemed “overfished.” A fish population can be “overfished” as the result of many factors, including overfishing, as well as habitat degradation, pollution, climate change, and disease. The Magnuson-Stevens Act mandates that overfished stocks and stocks experiencing overfishing be reported annually. Stock status is determined by NOAA, based on the results of stock assessments.
Data Source:
Data were obtained from the NOAA Fisheries Fishery Stock Status website. Stocks that met the criteria for overfished status were summed by year for each region.
California Current Overfished Stocks
Between 2020 and 2025 the number of overfished stocks shows a significant decreasing trend.
The x-axis represents years. The y-axis represents the number of fish stocks or fish populations that are deemed by NOAA as overfished. Overfished means the population of fish is too low. Therefore the population cannot support a large amount of fishing.
Description of time series:
The series shows the number of fish populations that have been listed as overfished since 2000. Between 2020 and 2025 the number of overfished stocks shows a significant decreasing trend.
Description of Overfished stocks:
An overfished stock is a population of fish that is too low. A stock that is experiencing overfishing has an annual rate of catch that is too high. Therefore the population cannot support that level of fishing and is below that level is deemed “overfished.” A fish population can be “overfished” as the result of many factors, including overfishing, as well as habitat degradation, pollution, climate change, and disease. The Magnuson-Stevens Act mandates that overfished stocks and stocks experiencing overfishing be reported annually. Stock status is determined by NOAA, based on the results of stock assessments.
Data Source:
Data were obtained from the NOAA Fisheries Fishery Stock Status website. Stocks that met the criteria for overfished status were summed by year for each region.
Gulf of America Overfished Stocks
Between 2020 and 2025 the number of overfished stocks shows no trend.
The x-axis represents years. The y-axis represents the number of fish stocks or fish populations that are deemed by NOAA as overfished. Overfished means the population of fish is too low. Therefore the population cannot support a large amount of fishing.
Description of time series:
The series shows the number of fish populations that have been listed as overfished since 2000. Between 2020 and 2025 the number of overfished stocks shows no trend.
Description of Overfished stocks:
An overfished stock is a population of fish that is too low. A stock that is experiencing overfishing has an annual rate of catch that is too high. Therefore the population cannot support that level of fishing and is below that level is deemed “overfished.” A fish population can be “overfished” as the result of many factors, including overfishing, as well as habitat degradation, pollution, climate change, and disease. The Magnuson-Stevens Act mandates that overfished stocks and stocks experiencing overfishing be reported annually. Stock status is determined by NOAA, based on the results of stock assessments.
Data Source:
Data were obtained from the NOAA Fisheries Fishery Stock Status website. Stocks that met the criteria for overfished status were summed by year for each region.
US Caribbean Overfished Stocks
Between 2020 and 2025 the number of overfished stocks shows no trend.
The x-axis represents years. The y-axis represents the number of fish stocks or fish populations that are deemed by NOAA as overfished. Overfished means the population of fish is too low. Therefore the population cannot support a large amount of fishing.
Description of time series:
The series shows the number of fish populations that have been listed as overfished since 2000. Between 2020 and 2025 the number of overfished stocks shows no trend.
Description of Overfished stocks:
An overfished stock is a population of fish that is too low. A stock that is experiencing overfishing has an annual rate of catch that is too high. Therefore the population cannot support that level of fishing and is below that level is deemed “overfished.” A fish population can be “overfished” as the result of many factors, including overfishing, as well as habitat degradation, pollution, climate change, and disease. The Magnuson-Stevens Act mandates that overfished stocks and stocks experiencing overfishing be reported annually. Stock status is determined by NOAA, based on the results of stock assessments.
Data Source:
Data were obtained from the NOAA Fisheries Fishery Stock Status website. Stocks that met the criteria for overfished status were summed by year for each region.
Close
Southeast Overfished Stocks
Between 2020 and 2025 the number of overfished stocks shows no trend.
The x-axis represents years. The y-axis represents the number of fish stocks or fish populations that are deemed by NOAA as overfished. Overfished means the population of fish is too low. Therefore the population cannot support a large amount of fishing.
Description of time series:
The series shows the number of fish populations that have qualified as overfished since 2000. Between 2020 and 2025 the number of overfished stocks shows no trend.
Description of Overfished stocks:
An overfished stock is a population of fish that is too low. A stock that is experiencing overfishing has an annual rate of catch that is too high. Therefore the population cannot support that level of fishing and is below that level is deemed “overfished.” A fish population can be “overfished” as the result of many factors, including overfishing, as well as habitat degradation, pollution, climate change, and disease. The Magnuson-Stevens Act mandates that overfished stocks and stocks experiencing overfishing be reported annually. Stock status is determined by NOAA, based on the results of stock assessments.
Data Source:
Data were obtained from the NOAA Fisheries Fishery Stock Status website. Stocks that met the criteria for overfished status were summed by year for each region.
Close
Northeast Overfished Stocks
Between 2020 and 2025 the number of overfished stocks shows no trend.
The x-axis represents years. The y-axis represents the number of fish stocks or fish populations that are deemed by NOAA as overfished. Overfished means the population of fish is too low. Therefore the population cannot support a large amount of fishing.
Description of time series:
The series shows the number of fish populations that have been listed as overfished since 2000. Between 2020 and 2025 the number of overfished stocks shows no trend.
Description of Overfished stocks:
An overfished stock is a population of fish that is too low. A stock that is experiencing overfishing has an annual rate of catch that is too high. Therefore the population cannot support that level of fishing and is below that level is deemed “overfished.” A fish population can be “overfished” as the result of many factors, including overfishing, as well as habitat degradation, pollution, climate change, and disease. The Magnuson-Stevens Act mandates that overfished stocks and stocks experiencing overfishing be reported annually. Stock status is determined by NOAA, based on the results of stock assessments.
Data Source:
Data were obtained from the NOAA Fisheries Fishery Stock Status website. Stocks that met the criteria for overfished status were summed by year for each region.

Resources
Status of U.S. Fisheries Report to Congress and Fishery Stock Status Updates
NOAA Fisheries publishes the annual Status of U.S. Fisheries Report to Congress of fish stocks managed under federal fishery management plans, and updates the status quarterly based on stock assessments completed during that quarter.

The Fish Stock Sustainability Index
NOAA Fisheries reports the Fish Stock Sustainability Index, a quarterly index that measures the performance of U.S. federal fisheries.

Stock SMART - Status, Management, Assessments & Resource Trends
Stock SMART is NOAA Fisheries' Stock Status, Management, Assessment, and Resource Trends web tool. Here, you can find applications to search, view, compare, and download the results of assessments for stocks managed by NOAA Fisheries. Keep reading to learn more about each of Stock SMART’s applications or click on a menu item to get started.

FOSS - Fisheries One Stop Shop
NOAA Fisheries One Stop Shop Database
