
Description of Marine Heatwaves (Spatial Coverage and Integrated Degree Days):
When ocean temperatures are exceptionally high in a specific area for an extended period of time, it has the potential to affect the biology and chemistry of an ecosystem. Marine heatwaves are events where temperatures are unusually high for an extended period. One commonly used metric defines a marine heatwave as an event where temperatures exceed the 90th percentile of 30-year historic values for five or more days in a row. Understanding the duration, intensity, and spatial coverage of marine heatwaves is important to coastal communities as increased incidence of intense heatwave events may affect the area available for fishing, recreational, or cultural practices and the overall health of a local ecosystem.
We present two metrics for marine heatwaves: a spatial coverage indicator describing the percentage of a Large Marine Ecosystem that is affected by marine heatwaves, and a heatwave intensity indicator that combines how hot the heatwaves are and how long they last. The spatial coverage indicator is calculated as the daily fraction of the total Large Marine Ecosystem area that is affected, averaged over each month. The heatwave intensity indicator adds up the strength of the temperature anomaly (degrees over the historic baseline) over the total duration of each heatwave, resulting in a measure called “degree days”. We present the annually averaged degree days for each Large Marine Ecosystem.
Check out our indicator highlight on SST and Marine heatwaves here.
Data Source:
The marine heatwave data shown here are calculated by NOAA’s National Centers for Environmental Information using Optimum Interpolation Sea Surface Temperature (OISST) data. The NOAA 1/4° OISST is a long-term Climate Data Record that incorporates observations from different platforms (satellites, ships, buoys and Argo floats) into a regular global grid. The dataset is interpolated to fill gaps on the grid and create a spatially complete map of sea surface temperature. Satellite and ship observations are referenced to buoys to compensate for platform differences and sensor biases. Indicator is calculated by Boyin Huang of NOAA NCEI
For the most up to date data, please reference the original source above.
Understanding the Time series plots
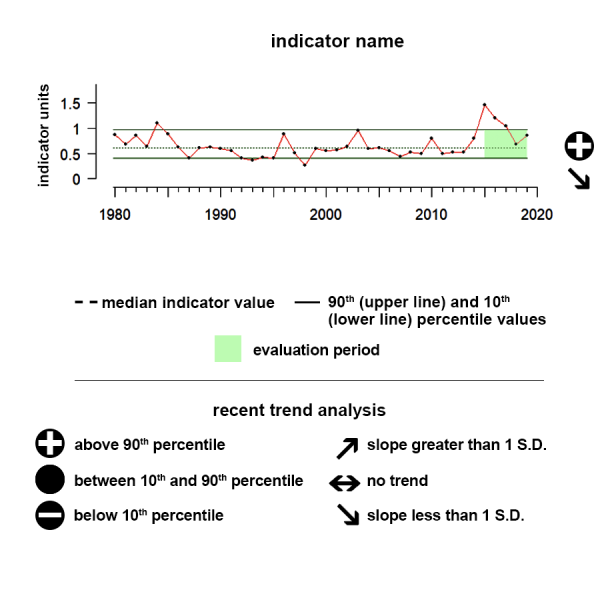
Time series plots show the changes in each indicator as a function of time, over the period 1980-present. Each plot also shows horizontal lines that indicate the median (middle) value of that indicator, as well as the 10th and 90th percentiles, each calculated for the entire period of measurement. Time series plots were only developed for datasets with at least 10 years of data. Two symbols located to the right of each plot describe how recent values of an indicator compare against the overall series. A black circle indicates whether the indicator values over the last five years are on average above the series 90th percentile (plus sign), below the 10th percentile (minus sign), or between those two values (solid circle). Beneath that an arrow reflects the trend of the indicator over the last five years; an increase or decrease greater than one standard deviation is reflected in upward or downward arrows respectively, while a change of less than one standard deviation is recorded by a left-right arrow.
Eastern Bering Sea Heatwave Intensity
During the last five years there has been a significant decreasing trend and the five-year average is between the 10th and 90th percentiles of all observed data in the time series.
Values indicate cumulative annual heatwave intensity and duration in a region in degree-days
Description of Time Series: This time series shows the average integrated degree day value for the Eastern Bering Sea region. During the last five years there has been a significant decreasing trend and the five-year average is between the 10th and 90th percentiles of all observed data in the time series.
Indicator Source Information:
The marine heatwave data shown here are calculated by NOAA’s National Centers for Environmental Information using Optimum Interpolation Sea Surface Temperature (OISST) data. The NOAA 1/4° OISST is a long term Climate Data Record that incorporates observations from different platforms (satellites, ships, buoys and Argo floats) into a regular global grid. The dataset is interpolated to fill gaps on the grid and create a spatially complete map of sea surface temperature. Satellite and ship observations are referenced to buoys to compensate for platform differences and sensor biases.
Data Background and Caveats:
Heatwave metrics are calculated using OISST, a product that uses some forms of interpolation to fill data gaps. Heatwaves are defined by Hobday et al., 2016 as distinct events where SST anomaly reaches the 90th percentile in a pixel for at least 5 days, separated out by 3 or more days.
Gulf of Alaska Heatwave Intensity
During the last five years there has been no trend and the five-year average is between the 10th and 90th percentiles of all observed data in the time series.
Values indicate cumulative annual heatwave intensity and duration in a region in degree-days
Description of Time Series: This time series shows the average integrated degree day value for the Gulf of Alaska region. During the last five years there has been no trend and the five-year average is between the 10th and 90th percentiles of all observed data in the time series.
Indicator Source Information:
The marine heatwave data shown here are calculated by NOAA’s National Centers for Environmental Information using Optimum Interpolation Sea Surface Temperature (OISST) data. The NOAA 1/4° OISST is a long term Climate Data Record that incorporates observations from different platforms (satellites, ships, buoys and Argo floats) into a regular global grid. The dataset is interpolated to fill gaps on the grid and create a spatially complete map of sea surface temperature. Satellite and ship observations are referenced to buoys to compensate for platform differences and sensor biases.
Data Background and Caveats:
Heatwave metrics are calculated using OISST, a product that uses some forms of interpolation to fill data gaps. Heatwaves are defined by Hobday et al., 2016 as distinct events where SST anomaly reaches the 90th percentile in a pixel for at least 5 days, separated out by 3 or more days.
Chukchi Sea Heatwave Intensity
During the last five years there has been no trend and the five-year average is between the 10th and 90th percentiles of all observed data in the time series.
Values indicate cumulative annual heatwave intensity and duration in a region in degree-days
Description of Time Series: This time series shows the average integrated degree day value for the Chukchi Sea region. During the last five years there has been no trend and the five-year average is between the 10th and 90th percentiles of all observed data in the time series.
Indicator Source Information:
The marine heatwave data shown here are calculated by NOAA’s National Centers for Environmental Information using Optimum Interpolation Sea Surface Temperature (OISST) data. The NOAA 1/4° OISST is a long term Climate Data Record that incorporates observations from different platforms (satellites, ships, buoys and Argo floats) into a regular global grid. The dataset is interpolated to fill gaps on the grid and create a spatially complete map of sea surface temperature. Satellite and ship observations are referenced to buoys to compensate for platform differences and sensor biases.
Data Background and Caveats:
Heatwave metrics are calculated using OISST, a product that uses some forms of interpolation to fill data gaps. Heatwaves are defined by Hobday et al., 2016 as distinct events where SST anomaly reaches the 90th percentile in a pixel for at least 5 days, separated out by 3 or more days.
Gulf of America Heatwave Intensity
During the last five years there has been no trend and the five-year average is above the 90th percentile of all observed data in the time series.
Values indicate cumulative annual heatwave intensity and duration in a region in degree-days
Description of Time Series: This time series shows the average integrated degree day value for the Gulf of America region. During the last five years there has been no trend and the five-year average is above the 90th percentile of all observed data in the time series.
Indicator Source Information:
The marine heatwave data shown here are calculated by NOAA’s National Centers for Environmental Information using Optimum Interpolation Sea Surface Temperature (OISST) data. The NOAA 1/4° OISST is a long term Climate Data Record that incorporates observations from different platforms (satellites, ships, buoys and Argo floats) into a regular global grid. The dataset is interpolated to fill gaps on the grid and create a spatially complete map of sea surface temperature. Satellite and ship observations are referenced to buoys to compensate for platform differences and sensor biases.
Data Background and Caveats:
Heatwave metrics are calculated using OISST, a product that uses some forms of interpolation to fill data gaps. Heatwaves are defined by Hobday et al., 2016 as distinct events where SST anomaly reaches the 90th percentile in a pixel for at least 5 days, separated out by 3 or more days.
Northeast Heatwave Intensity
During the last five years there has been a decreasing trend and the five-year average is between the 10th and 90th percentiles of all observed data in the time series.
Values indicate cumulative annual heatwave intensity and duration in a region in degree-days
Description of Time Series: This time series shows the average integrated degree day value for the Northeast region. During the last five years there has been a decreasing trend and the five-year average is between the 10th and 90th percentiles of all observed data in the time series.
Indicator Source Information:
The marine heatwave data shown here are calculated by NOAA’s National Centers for Environmental Information using Optimum Interpolation Sea Surface Temperature (OISST) data. The NOAA 1/4° OISST is a long term Climate Data Record that incorporates observations from different platforms (satellites, ships, buoys and Argo floats) into a regular global grid. The dataset is interpolated to fill gaps on the grid and create a spatially complete map of sea surface temperature. Satellite and ship observations are referenced to buoys to compensate for platform differences and sensor biases.
Data Background and Caveats:
Heatwave metrics are calculated using OISST, a product that uses some forms of interpolation to fill data gaps. Heatwaves are defined by Hobday et al., 2016 as distinct events where SST anomaly reaches the 90th percentile in a pixel for at least 5 days, separated out by 3 or more days.
Southeast Heatwave Intensity
During the last five years there has been no trend and the five-year average is between the 10th and 90th percentiles of all observed data in the time series.
Values indicate cumulative annual heatwave intensity and duration in a region in degree-days
Description of Time Series: This time series shows the average integrated degree day value for the Southeast region. During the last five years there has been no trend and the five-year average is between the 10th and 90th percentiles of all observed data in the time series.
Indicator Source Information:
The marine heatwave data shown here are calculated by NOAA’s National Centers for Environmental Information using Optimum Interpolation Sea Surface Temperature (OISST) data. The NOAA 1/4° OISST is a long term Climate Data Record that incorporates observations from different platforms (satellites, ships, buoys and Argo floats) into a regular global grid. The dataset is interpolated to fill gaps on the grid and create a spatially complete map of sea surface temperature. Satellite and ship observations are referenced to buoys to compensate for platform differences and sensor biases.
Data Background and Caveats:
Heatwave metrics are calculated using OISST, a product that uses some forms of interpolation to fill data gaps. Heatwaves are defined by Hobday et al., 2016 as distinct events where SST anomaly reaches the 90th percentile in a pixel for at least 5 days, separated out by 3 or more days.
California Current Heatwave Intensity
During the last five years there has been no trend and the five-year average is between the 10th and 90th percentiles of all observed data in the time series.
Values indicate cumulative annual heatwave intensity and duration in a region in degree-days
Description of Time Series: This time series shows the average integrated degree day value for the California Current region. During the last five years there has been no trend and the five-year average is between the 10th and 90th percentiles of all observed data in the time series.
Indicator Source Information:
The marine heatwave data shown here are calculated by NOAA’s National Centers for Environmental Information using Optimum Interpolation Sea Surface Temperature (OISST) data. The NOAA 1/4° OISST is a long term Climate Data Record that incorporates observations from different platforms (satellites, ships, buoys and Argo floats) into a regular global grid. The dataset is interpolated to fill gaps on the grid and create a spatially complete map of sea surface temperature. Satellite and ship observations are referenced to buoys to compensate for platform differences and sensor biases.
Data Background and Caveats:
Heatwave metrics are calculated using OISST, a product that uses some forms of interpolation to fill data gaps. Heatwaves are defined by Hobday et al., 2016 as distinct events where SST anomaly reaches the 90th percentile in a pixel for at least 5 days, separated out by 3 or more days.
American Samoa Heatwave Intensity
During the last five years there has been a significant increasing trend and the five-year average is above the 90th percentile of all observed data in the time series.
Values indicate cumulative annual heatwave intensity and duration in a region in degree-days
Description of Time Series: This time series shows the average integrated degree day value for the American Samoa region. During the last five years there has been a significant increasing trend and the five-year average is above the 90th percentile of all observed data in the time series.
Indicator Source Information:
The marine heatwave data shown here are calculated by NOAA’s National Centers for Environmental Information using Optimum Interpolation Sea Surface Temperature (OISST) data. The NOAA 1/4° OISST is a long term Climate Data Record that incorporates observations from different platforms (satellites, ships, buoys and Argo floats) into a regular global grid. The dataset is interpolated to fill gaps on the grid and create a spatially complete map of sea surface temperature. Satellite and ship observations are referenced to buoys to compensate for platform differences and sensor biases.
Data Background and Caveats:
Heatwave metrics are calculated using OISST, a product that uses some forms of interpolation to fill data gaps. Heatwaves are defined by Hobday et al., 2016 as distinct events where SST anomaly reaches the 90th percentile in a pixel for at least 5 days, separated out by 3 or more days.
Caribbean Heatwave Intensity
During the last five years there has been a significant increasing trend and the five-year average is above the 90th percentile of all observed data in the time series.
Values indicate cumulative annual heatwave intensity and duration in a region in degree-days
Description of Time Series: This time series shows the average integrated degree day value for the Caribbean region. During the last five years there has been a significant increasing trend and the five-year average is above the 90th percentile of all observed data in the time series.
Indicator Source Information:
The marine heatwave data shown here are calculated by NOAA’s National Centers for Environmental Information using Optimum Interpolation Sea Surface Temperature (OISST) data. The NOAA 1/4° OISST is a long term Climate Data Record that incorporates observations from different platforms (satellites, ships, buoys and Argo floats) into a regular global grid. The dataset is interpolated to fill gaps on the grid and create a spatially complete map of sea surface temperature. Satellite and ship observations are referenced to buoys to compensate for platform differences and sensor biases.
Data Background and Caveats:
Heatwave metrics are calculated using OISST, a product that uses some forms of interpolation to fill data gaps. Heatwaves are defined by Hobday et al., 2016 as distinct events where SST anomaly reaches the 90th percentile in a pixel for at least 5 days, separated out by 3 or more days.
Guam and CNMI Heatwave Intensity
During the last five years there has been no trend and the five-year average is above the 90th percentile of all observed data in the time series.
Values indicate cumulative annual heatwave intensity and duration in a region in degree-days
Description of Time Series: This time series shows the average integrated degree day value for the Guam region. During the last five years there has been no trend and the five-year average is above the 90th percentile of all observed data in the time series.
Indicator Source Information:
The marine heatwave data shown here are calculated by NOAA’s National Centers for Environmental Information using Optimum Interpolation Sea Surface Temperature (OISST) data. The NOAA 1/4° OISST is a long term Climate Data Record that incorporates observations from different platforms (satellites, ships, buoys and Argo floats) into a regular global grid. The dataset is interpolated to fill gaps on the grid and create a spatially complete map of sea surface temperature. Satellite and ship observations are referenced to buoys to compensate for platform differences and sensor biases.
Data Background and Caveats:
Heatwave metrics are calculated using OISST, a product that uses some forms of interpolation to fill data gaps. Heatwaves are defined by Hobday et al., 2016 as distinct events where SST anomaly reaches the 90th percentile in a pixel for at least 5 days, separated out by 3 or more days.
Howland and Baker Islands Heatwave Intensity
During the last five years there has been a significant increasing trend and the five-year average is between the 10th and 90th percentiles of all observed data in the time series.
Values indicate cumulative annual heatwave intensity and duration in a region in degree-days
Description of Time Series: This time series shows the average integrated degree day value for the Howland and Baker Islands region. During the last five years there has been a significant increasing trend and the five-year average is between the 10th and 90th percentiles of all observed data in the time series.
Indicator Source Information:
The marine heatwave data shown here are calculated by NOAA’s National Centers for Environmental Information using Optimum Interpolation Sea Surface Temperature (OISST) data. The NOAA 1/4° OISST is a long term Climate Data Record that incorporates observations from different platforms (satellites, ships, buoys and Argo floats) into a regular global grid. The dataset is interpolated to fill gaps on the grid and create a spatially complete map of sea surface temperature. Satellite and ship observations are referenced to buoys to compensate for platform differences and sensor biases.
Data Background and Caveats:
Heatwave metrics are calculated using OISST, a product that uses some forms of interpolation to fill data gaps. Heatwaves are defined by Hobday et al., 2016 as distinct events where SST anomaly reaches the 90th percentile in a pixel for at least 5 days, separated out by 3 or more days.
Jarvis Island Heatwave Intensity
During the last five years there has been no trend and the five-year average is between the 10th and 90th percentiles of all observed data in the time series.
Values indicate cumulative annual heatwave intensity and duration in a region in degree-days
Description of Time Series: This time series shows the average integrated degree day value for the Jarvis Island region. During the last five years there has been no trend and the five-year average is between the 10th and 90th percentiles of all observed data in the time series.
Indicator Source Information:
The marine heatwave data shown here are calculated by NOAA’s National Centers for Environmental Information using Optimum Interpolation Sea Surface Temperature (OISST) data. The NOAA 1/4° OISST is a long term Climate Data Record that incorporates observations from different platforms (satellites, ships, buoys and Argo floats) into a regular global grid. The dataset is interpolated to fill gaps on the grid and create a spatially complete map of sea surface temperature. Satellite and ship observations are referenced to buoys to compensate for platform differences and sensor biases.
Data Background and Caveats:
Heatwave metrics are calculated using OISST, a product that uses some forms of interpolation to fill data gaps. Heatwaves are defined by Hobday et al., 2016 as distinct events where SST anomaly reaches the 90th percentile in a pixel for at least 5 days, separated out by 3 or more days.
Johnson Atoll Heatwave Intensity
During the last five years there has been an increasing trend and the five-year average is between the 10th and 90th percentiles of all observed data in the time series.
Values indicate cumulative annual heatwave intensity and duration in a region in degree-days
Description of Time Series: This time series shows the average integrated degree day value for the Johnson Atoll region. During the last five years there has been an increasing trend and the five-year average is between the 10th and 90th percentiles of all observed data in the time series.
Indicator Source Information:
The marine heatwave data shown here are calculated by NOAA’s National Centers for Environmental Information using Optimum Interpolation Sea Surface Temperature (OISST) data. The NOAA 1/4° OISST is a long term Climate Data Record that incorporates observations from different platforms (satellites, ships, buoys and Argo floats) into a regular global grid. The dataset is interpolated to fill gaps on the grid and create a spatially complete map of sea surface temperature. Satellite and ship observations are referenced to buoys to compensate for platform differences and sensor biases.
Data Background and Caveats:
Heatwave metrics are calculated using OISST, a product that uses some forms of interpolation to fill data gaps. Heatwaves are defined by Hobday et al., 2016 as distinct events where SST anomaly reaches the 90th percentile in a pixel for at least 5 days, separated out by 3 or more days.
Kingman Reef & Palmyra Atoll Heatwave Intensity
During the last five years there has been no trend and the five-year average is between the 10th and 90th percentiles of all observed data in the time series.
Values indicate cumulative annual heatwave intensity and duration in a region in degree-days
Description of Time Series: This time series shows the average integrated degree day value for the Kingman Reef and Palmyra Atoll region. During the last five years there has been no trend and the five-year average is between the 10th and 90th percentiles of all observed data in the time series.
Indicator Source Information:
The marine heatwave data shown here are calculated by NOAA’s National Centers for Environmental Information using Optimum Interpolation Sea Surface Temperature (OISST) data. The NOAA 1/4° OISST is a long term Climate Data Record that incorporates observations from different platforms (satellites, ships, buoys and Argo floats) into a regular global grid. The dataset is interpolated to fill gaps on the grid and create a spatially complete map of sea surface temperature. Satellite and ship observations are referenced to buoys to compensate for platform differences and sensor biases.
Data Background and Caveats:
Heatwave metrics are calculated using OISST, a product that uses some forms of interpolation to fill data gaps. Heatwaves are defined by Hobday et al., 2016 as distinct events where SST anomaly reaches the 90th percentile in a pixel for at least 5 days, separated out by 3 or more days.
Wake Island Heatwave Intensity
During the last five years there has been a significant increasing trend and the five-year average is between the 10th and 90th percentiles of all observed data in the time series.
Values indicate cumulative annual heatwave intensity and duration in a region in degree-days
Description of Time Series: This time series shows the average integrated degree day value for the Wake Island region. During the last five years there has been a significant increasing trend and the five-year average is between the 10th and 90th percentiles of all observed data in the time series.
Indicator Source Information:
The marine heatwave data shown here are calculated by NOAA’s National Centers for Environmental Information using Optimum Interpolation Sea Surface Temperature (OISST) data. The NOAA 1/4° OISST is a long term Climate Data Record that incorporates observations from different platforms (satellites, ships, buoys and Argo floats) into a regular global grid. The dataset is interpolated to fill gaps on the grid and create a spatially complete map of sea surface temperature. Satellite and ship observations are referenced to buoys to compensate for platform differences and sensor biases.
Data Background and Caveats:
Heatwave metrics are calculated using OISST, a product that uses some forms of interpolation to fill data gaps. Heatwaves are defined by Hobday et al., 2016 as distinct events where SST anomaly reaches the 90th percentile in a pixel for at least 5 days, separated out by 3 or more days.
Great Lakes Heatwave Intensity
During the last five years there has been no trend and the five-year average is between the 10th and 90th percentiles of all observed data in the time series.
Values indicate cumulative annual heatwave intensity and duration in a region in degree-days
Description of Time Series: This time series shows the average integrated degree day value for the Great Lakes region. During the last five years there has been no trend and the five-year average is between the 10th and 90th percentiles of all observed data in the time series.
Indicator Source Information:
The marine heatwave data shown here are calculated by NOAA’s National Centers for Environmental Information using Optimum Interpolation Sea Surface Temperature (OISST) data. The NOAA 1/4° OISST is a long term Climate Data Record that incorporates observations from different platforms (satellites, ships, buoys and Argo floats) into a regular global grid. The dataset is interpolated to fill gaps on the grid and create a spatially complete map of sea surface temperature. Satellite and ship observations are referenced to buoys to compensate for platform differences and sensor biases.
Data Background and Caveats:
Heatwave metrics are calculated using OISST, a product that uses some forms of interpolation to fill data gaps. Heatwaves are defined by Hobday et al., 2016 as distinct events where SST anomaly reaches the 90th percentile in a pixel for at least 5 days, separated out by 3 or more days.
Lake Ontario Heatwave Intensity
During the last five years there has been no trend and the five-year average is above the 90th percentile of all observed data in the time series.
Values indicate cumulative annual heatwave intensity and duration in a region in degree-days
Description of Time Series: This time series shows the average integrated degree day value for the Lake Ontario region. During the last five years there has been no trend and the five-year average is above the 90th percentile of all observed data in the time series.
Indicator Source Information:
The marine heatwave data shown here are calculated by NOAA’s National Centers for Environmental Information using Optimum Interpolation Sea Surface Temperature (OISST) data. The NOAA 1/4° OISST is a long term Climate Data Record that incorporates observations from different platforms (satellites, ships, buoys and Argo floats) into a regular global grid. The dataset is interpolated to fill gaps on the grid and create a spatially complete map of sea surface temperature. Satellite and ship observations are referenced to buoys to compensate for platform differences and sensor biases.
Data Background and Caveats:
Heatwave metrics are calculated using OISST, a product that uses some forms of interpolation to fill data gaps. Heatwaves are defined by Hobday et al., 2016 as distinct events where SST anomaly reaches the 90th percentile in a pixel for at least 5 days, separated out by 3 or more days.
Lake Erie Heatwave Intensity
During the last five years there has been no trend and the five-year average is between the 10th and 90th percentiles of all observed data in the time series.
Values indicate cumulative annual heatwave intensity and duration in a region in degree-days
Description of Time Series: This time series shows the average integrated degree day value for the Lake Erie region. During the last five years there has been no trend and the five-year average is between the 10th and 90th percentiles of all observed data in the time series.
Indicator Source Information:
The marine heatwave data shown here are calculated by NOAA’s National Centers for Environmental Information using Optimum Interpolation Sea Surface Temperature (OISST) data. The NOAA 1/4° OISST is a long term Climate Data Record that incorporates observations from different platforms (satellites, ships, buoys and Argo floats) into a regular global grid. The dataset is interpolated to fill gaps on the grid and create a spatially complete map of sea surface temperature. Satellite and ship observations are referenced to buoys to compensate for platform differences and sensor biases.
Data Background and Caveats:
Heatwave metrics are calculated using OISST, a product that uses some forms of interpolation to fill data gaps. Heatwaves are defined by Hobday et al., 2016 as distinct events where SST anomaly reaches the 90th percentile in a pixel for at least 5 days, separated out by 3 or more days.
Lake Huron Heatwave Intensity
During the last five years there has been no trend and the five-year average is above the 90th percentile of all observed data in the time series.
Values indicate cumulative annual heatwave intensity and duration in a region in degree-days
Description of Time Series: This time series shows the average integrated degree day value for the Lake Huron region. During the last five years there has been no trend and the five-year average is above the 90th percentile of all observed data in the time series.
Indicator Source Information:
The marine heatwave data shown here are calculated by NOAA’s National Centers for Environmental Information using Optimum Interpolation Sea Surface Temperature (OISST) data. The NOAA 1/4° OISST is a long term Climate Data Record that incorporates observations from different platforms (satellites, ships, buoys and Argo floats) into a regular global grid. The dataset is interpolated to fill gaps on the grid and create a spatially complete map of sea surface temperature. Satellite and ship observations are referenced to buoys to compensate for platform differences and sensor biases.
Data Background and Caveats:
Heatwave metrics are calculated using OISST, a product that uses some forms of interpolation to fill data gaps. Heatwaves are defined by Hobday et al., 2016 as distinct events where SST anomaly reaches the 90th percentile in a pixel for at least 5 days, separated out by 3 or more days.
Lake Michigan Heatwave Intensity
During the last five years there has been no trend and the five-year average is above the 90th percentile of all observed data in the time series.
Values indicate cumulative annual heatwave intensity and duration in a region in degree-days
Description of Time Series: This time series shows the average integrated degree day value for the Lake Michigan region. During the last five years there has been no trend and the five-year average is above the 90th percentile of all observed data in the time series.
Indicator Source Information:
The marine heatwave data shown here are calculated by NOAA’s National Centers for Environmental Information using Optimum Interpolation Sea Surface Temperature (OISST) data. The NOAA 1/4° OISST is a long term Climate Data Record that incorporates observations from different platforms (satellites, ships, buoys and Argo floats) into a regular global grid. The dataset is interpolated to fill gaps on the grid and create a spatially complete map of sea surface temperature. Satellite and ship observations are referenced to buoys to compensate for platform differences and sensor biases.
Data Background and Caveats:
Heatwave metrics are calculated using OISST, a product that uses some forms of interpolation to fill data gaps. Heatwaves are defined by Hobday et al., 2016 as distinct events where SST anomaly reaches the 90th percentile in a pixel for at least 5 days, separated out by 3 or more days.
Lake Superior Heatwave Intensity
During the last five years there has been no trend and the five-year average is between the 10th and 90th percentiles of all observed data in the time series.
Values indicate cumulative annual heatwave intensity and duration in a region in degree-days
Description of Time Series: This time series shows the average integrated degree day value for the Lake Superior region. During the last five years there has been no trend and the five-year average is between the 10th and 90th percentiles of all observed data in the time series.
Indicator Source Information:
The marine heatwave data shown here are calculated by NOAA’s National Centers for Environmental Information using Optimum Interpolation Sea Surface Temperature (OISST) data. The NOAA 1/4° OISST is a long term Climate Data Record that incorporates observations from different platforms (satellites, ships, buoys and Argo floats) into a regular global grid. The dataset is interpolated to fill gaps on the grid and create a spatially complete map of sea surface temperature. Satellite and ship observations are referenced to buoys to compensate for platform differences and sensor biases.
Data Background and Caveats:
Heatwave metrics are calculated using OISST, a product that uses some forms of interpolation to fill data gaps. Heatwaves are defined by Hobday et al., 2016 as distinct events where SST anomaly reaches the 90th percentile in a pixel for at least 5 days, separated out by 3 or more days.
Beaufort Sea Heatwave Intensity
During the last five years there has been no trend and the five-year average is between the 10th and 90th percentiles of all observed data in the time series.
Values indicate cumulative annual heatwave intensity and duration in a region in degree-days
Description of Time Series: This time series shows the average integrated degree day value for the Beaufort Sea region. During the last five years there has been no trend and the five-year average is between the 10th and 90th percentiles of all observed data in the time series.
Indicator Source Information:
The marine heatwave data shown here are calculated by NOAA’s National Centers for Environmental Information using Optimum Interpolation Sea Surface Temperature (OISST) data. The NOAA 1/4° OISST is a long term Climate Data Record that incorporates observations from different platforms (satellites, ships, buoys and Argo floats) into a regular global grid. The dataset is interpolated to fill gaps on the grid and create a spatially complete map of sea surface temperature. Satellite and ship observations are referenced to buoys to compensate for platform differences and sensor biases.
Data Background and Caveats:
Heatwave metrics are calculated using OISST, a product that uses some forms of interpolation to fill data gaps. Heatwaves are defined by Hobday et al., 2016 as distinct events where SST anomaly reaches the 90th percentile in a pixel for at least 5 days, separated out by 3 or more days.
Hawaiian Islands Heatwave Intensity
During the last five years there has been no trend and the five-year average is between the 10th and 90th percentiles of all observed data in the time series.
Values indicate cumulative annual heatwave intensity and duration in a region in degree-days
Description of Time Series: This time series shows the average integrated degree day value for the Main Hawaiian Islands region. During the last five years there has been no trend and the five-year average is between the 10th and 90th percentiles of all observed data in the time series.
Indicator Source Information:
The marine heatwave data shown here are calculated by NOAA’s National Centers for Environmental Information using Optimum Interpolation Sea Surface Temperature (OISST) data. The NOAA 1/4° OISST is a long term Climate Data Record that incorporates observations from different platforms (satellites, ships, buoys and Argo floats) into a regular global grid. The dataset is interpolated to fill gaps on the grid and create a spatially complete map of sea surface temperature. Satellite and ship observations are referenced to buoys to compensate for platform differences and sensor biases.
Data Background and Caveats:
Heatwave metrics are calculated using OISST, a product that uses some forms of interpolation to fill data gaps. Heatwaves are defined by Hobday et al., 2016 as distinct events where SST anomaly reaches the 90th percentile in a pixel for at least 5 days, separated out by 3 or more days.
Eastern Bering Sea Heatwave Area
During the last five years there has been no trend and the five-year average is between the 10th and 90th percentiles of all observed data in the time series.
Values indicate monthly percent of an LME area affected by heatwave
Description of Time Series:
This time series shows the monthly heatwave spatial coverage for the Eastern Bering Sea Region. During the last five years there has been no trend and the five-year average is between the 10th and 90th percentiles of all observed data in the time series.
Indicator Source Information:
The marine heatwave data shown here are calculated by NOAA’s National Centers for Environmental Information using Optimum Interpolation Sea Surface Temperature (OISST) data. The NOAA 1/4° OISST is a long term Climate Data Record that incorporates observations from different platforms (satellites, ships, buoys and Argo floats) into a regular global grid. The dataset is interpolated to fill gaps on the grid and create a spatially complete map of sea surface temperature. Satellite and ship observations are referenced to buoys to compensate for platform differences and sensor biases.
Data Background and Caveats:
Heatwave metrics are calculated using OISST, a product that uses some forms of interpolation to fill data gaps. Heatwaves are defined by Hobday et al., 2016 as distinct events where SST anomaly reaches the 90th percentile in a pixel for at least 5 days, separated out by 3 or more days.
Gulf of Alaska Heatwave Area
During the last five years there has been no trend and the five-year average is between the 10th and 90th percentiles of all observed data in the time series.
Values indicate monthly percent of an LME area affected by heatwave
Description of Time Series:
This time series shows the monthly heatwave spatial coverage for the Gulf of Alaska Region. During the last five years there has been no trend and the five-year average is between the 10th and 90th percentiles of all observed data in the time series.
Indicator Source Information:
The marine heatwave data shown here are calculated by NOAA’s National Centers for Environmental Information using Optimum Interpolation Sea Surface Temperature (OISST) data. The NOAA 1/4° OISST is a long term Climate Data Record that incorporates observations from different platforms (satellites, ships, buoys and Argo floats) into a regular global grid. The dataset is interpolated to fill gaps on the grid and create a spatially complete map of sea surface temperature. Satellite and ship observations are referenced to buoys to compensate for platform differences and sensor biases.
Data Background and Caveats:
Heatwave metrics are calculated using OISST, a product that uses some forms of interpolation to fill data gaps. Heatwaves are defined by Hobday et al., 2016 as distinct events where SST anomaly reaches the 90th percentile in a pixel for at least 5 days, separated out by 3 or more days.
Chukchi Sea Heatwave Area
During the last five years there has been a decreasing trend and the five-year average is between the 10th and 90th percentiles of all observed data in the time series.
Values indicate monthly percent of an LME area affected by heatwave
Description of Time Series:
This time series shows the monthly heatwave spatial coverage for the Chukchi Sea Region. During the last five years there has been a decreasing trend and the five-year average is between the 10th and 90th percentiles of all observed data in the time series.
Indicator Source Information:
The marine heatwave data shown here are calculated by NOAA’s National Centers for Environmental Information using Optimum Interpolation Sea Surface Temperature (OISST) data. The NOAA 1/4° OISST is a long term Climate Data Record that incorporates observations from different platforms (satellites, ships, buoys and Argo floats) into a regular global grid. The dataset is interpolated to fill gaps on the grid and create a spatially complete map of sea surface temperature. Satellite and ship observations are referenced to buoys to compensate for platform differences and sensor biases.
Data Background and Caveats:
Heatwave metrics are calculated using OISST, a product that uses some forms of interpolation to fill data gaps. Heatwaves are defined by Hobday et al., 2016 as distinct events where SST anomaly reaches the 90th percentile in a pixel for at least 5 days, separated out by 3 or more days.
Gulf of America Heatwave Area
During the last five years there has been no trend and the five-year average is above the 90th percentiles of all observed data in the time series.
Values indicate monthly percent of an LME area affected by heatwave
Description of Time Series:
This time series shows the monthly heatwave spatial coverage for the Gulf of America Region. During the last five years there has been no trend and the five-year average is above the 90th percentiles of all observed data in the time series.
Indicator Source Information:
The marine heatwave data shown here are calculated by NOAA’s National Centers for Environmental Information using Optimum Interpolation Sea Surface Temperature (OISST) data. The NOAA 1/4° OISST is a long term Climate Data Record that incorporates observations from different platforms (satellites, ships, buoys and Argo floats) into a regular global grid. The dataset is interpolated to fill gaps on the grid and create a spatially complete map of sea surface temperature. Satellite and ship observations are referenced to buoys to compensate for platform differences and sensor biases.
Data Background and Caveats:
Heatwave metrics are calculated using OISST, a product that uses some forms of interpolation to fill data gaps. Heatwaves are defined by Hobday et al., 2016 as distinct events where SST anomaly reaches the 90th percentile in a pixel for at least 5 days, separated out by 3 or more days.
Northeast Heatwave Area
During the last five years there has been no trend and the five-year average is between the 10th and 90th percentiles of all observed data in the time series.
Values indicate monthly percent of an LME area affected by heatwave
Description of Time Series:
This time series shows the monthly heatwave spatial coverage for the Northeast Region. During the last five years there has been no trend and the five-year average is between the 10th and 90th percentiles of all observed data in the time series.
Indicator Source Information:
The marine heatwave data shown here are calculated by NOAA’s National Centers for Environmental Information using Optimum Interpolation Sea Surface Temperature (OISST) data. The NOAA 1/4° OISST is a long term Climate Data Record that incorporates observations from different platforms (satellites, ships, buoys and Argo floats) into a regular global grid. The dataset is interpolated to fill gaps on the grid and create a spatially complete map of sea surface temperature. Satellite and ship observations are referenced to buoys to compensate for platform differences and sensor biases.
Data Background and Caveats:
Heatwave metrics are calculated using OISST, a product that uses some forms of interpolation to fill data gaps. Heatwaves are defined by Hobday et al., 2016 as distinct events where SST anomaly reaches the 90th percentile in a pixel for at least 5 days, separated out by 3 or more days.
Southeast Heatwave Area
During the last five years there has been no trend and the five-year average is between the 10th and 90th percentiles of all observed data in the time series.
Values indicate monthly percent of an LME area affected by heatwave
Description of Time Series:
This time series shows the monthly heatwave spatial coverage for the Southeast Region. During the last five years there has been no trend and the five-year average is between the 10th and 90th percentiles of all observed data in the time series.
Indicator Source Information:
The marine heatwave data shown here are calculated by NOAA’s National Centers for Environmental Information using Optimum Interpolation Sea Surface Temperature (OISST) data. The NOAA 1/4° OISST is a long term Climate Data Record that incorporates observations from different platforms (satellites, ships, buoys and Argo floats) into a regular global grid. The dataset is interpolated to fill gaps on the grid and create a spatially complete map of sea surface temperature. Satellite and ship observations are referenced to buoys to compensate for platform differences and sensor biases.
Data Background and Caveats:
Heatwave metrics are calculated using OISST, a product that uses some forms of interpolation to fill data gaps. Heatwaves are defined by Hobday et al., 2016 as distinct events where SST anomaly reaches the 90th percentile in a pixel for at least 5 days, separated out by 3 or more days.
California Current Heatwave Area
During the last five years there has been no trend and the five-year average is between the 10th and 90th percentiles of all observed data in the time series.
Values indicate monthly percent of an LME area affected by heatwave
Description of Time Series: This time series shows the monthly heatwave spatial coverage for the California Current Region. During the last five years there has been no trend and the five-year average is between the 10th and 90th percentiles of all observed data in the time series.
Indicator Source Information:
The marine heatwave data shown here are calculated by NOAA’s National Centers for Environmental Information using Optimum Interpolation Sea Surface Temperature (OISST) data. The NOAA 1/4° OISST is a long term Climate Data Record that incorporates observations from different platforms (satellites, ships, buoys and Argo floats) into a regular global grid. The dataset is interpolated to fill gaps on the grid and create a spatially complete map of sea surface temperature. Satellite and ship observations are referenced to buoys to compensate for platform differences and sensor biases.
Data Background and Caveats:
Heatwave metrics are calculated using OISST, a product that uses some forms of interpolation to fill data gaps. Heatwaves are defined by Hobday et al., 2016 as distinct events where SST anomaly reaches the 90th percentile in a pixel for at least 5 days, separated out by 3 or more days.
Caribbean Heatwave Area
During the last five years there has been no trend and the five-year average is between the 10th and 90th percentiles of all observed data in the time series.
Values indicate monthly percent of an LME area affected by heatwave
Description of Time Series:
This time series shows the monthly heatwave spatial coverage for the Caribbean Region. During the last five years there has been no trend and the five-year average is between the 10th and 90th percentiles of all observed data in the time series.
Indicator Source Information:
The marine heatwave data shown here are calculated by NOAA’s National Centers for Environmental Information using Optimum Interpolation Sea Surface Temperature (OISST) data. The NOAA 1/4° OISST is a long term Climate Data Record that incorporates observations from different platforms (satellites, ships, buoys and Argo floats) into a regular global grid. The dataset is interpolated to fill gaps on the grid and create a spatially complete map of sea surface temperature. Satellite and ship observations are referenced to buoys to compensate for platform differences and sensor biases.
Data Background and Caveats:
Heatwave metrics are calculated using OISST, a product that uses some forms of interpolation to fill data gaps. Heatwaves are defined by Hobday et al., 2016 as distinct events where SST anomaly reaches the 90th percentile in a pixel for at least 5 days, separated out by 3 or more days.
American Samoa Heatwave Area
During the last five years there has been no trend and the five-year average is between the 10th and 90th percentiles of all observed data in the time series.
Values indicate monthly percent of an LME area affected by heatwave
Description of Time Series:
This time series shows the monthly heatwave spatial coverage for the American Samoa Region. During the last five years there has been no trend and the five-year average is between the 10th and 90th percentiles of all observed data in the time series.
Indicator Source Information:
The marine heatwave data shown here are calculated by NOAA’s National Centers for Environmental Information using Optimum Interpolation Sea Surface Temperature (OISST) data. The NOAA 1/4° OISST is a long term Climate Data Record that incorporates observations from different platforms (satellites, ships, buoys and Argo floats) into a regular global grid. The dataset is interpolated to fill gaps on the grid and create a spatially complete map of sea surface temperature. Satellite and ship observations are referenced to buoys to compensate for platform differences and sensor biases.
Data Background and Caveats:
Heatwave metrics are calculated using OISST, a product that uses some forms of interpolation to fill data gaps. Heatwaves are defined by Hobday et al., 2016 as distinct events where SST anomaly reaches the 90th percentile in a pixel for at least 5 days, separated out by 3 or more days.
Guam and CNMI Heatwave Area
During the last five years there has been no trend and the five-year average is between the 10th and 90th percentiles of all observed data in the time series.
Values indicate monthly percent of an LME area affected by heatwave
Description of Time Series:
This time series shows the monthly heatwave spatial coverage for the Guam & CNMI Region. During the last five years there has been no trend and the five-year average is between the 10th and 90th percentiles of all observed data in the time series.
Indicator Source Information:
The marine heatwave data shown here are calculated by NOAA’s National Centers for Environmental Information using Optimum Interpolation Sea Surface Temperature (OISST) data. The NOAA 1/4° OISST is a long term Climate Data Record that incorporates observations from different platforms (satellites, ships, buoys and Argo floats) into a regular global grid. The dataset is interpolated to fill gaps on the grid and create a spatially complete map of sea surface temperature. Satellite and ship observations are referenced to buoys to compensate for platform differences and sensor biases.
Data Background and Caveats:
Heatwave metrics are calculated using OISST, a product that uses some forms of interpolation to fill data gaps. Heatwaves are defined by Hobday et al., 2016 as distinct events where SST anomaly reaches the 90th percentile in a pixel for at least 5 days, separated out by 3 or more days.
Hawaiian Islands Heatwave Area
During the last five years there has been no trend and the five-year average is between the 10th and 90th percentiles of all observed data in the time series.
Values indicate monthly percent of an LME area affected by heatwave
Description of Time Series:
This time series shows the monthly heatwave spatial coverage for the Hawaiian Islands Region. During the last five years there has been no trend and the five-year average is between the 10th and 90th percentiles of all observed data in the time series.
Indicator Source Information:
The marine heatwave data shown here are calculated by NOAA’s National Centers for Environmental Information using Optimum Interpolation Sea Surface Temperature (OISST) data. The NOAA 1/4° OISST is a long term Climate Data Record that incorporates observations from different platforms (satellites, ships, buoys and Argo floats) into a regular global grid. The dataset is interpolated to fill gaps on the grid and create a spatially complete map of sea surface temperature. Satellite and ship observations are referenced to buoys to compensate for platform differences and sensor biases.
Data Background and Caveats:
Heatwave metrics are calculated using OISST, a product that uses some forms of interpolation to fill data gaps. Heatwaves are defined by Hobday et al., 2016 as distinct events where SST anomaly reaches the 90th percentile in a pixel for at least 5 days, separated out by 3 or more days.
Howland and Baker Islands Heatwave Area
During the last five years there has been an increasing trend and the five-year average is between the 10th and 90th percentiles of all observed data in the time series.
Values indicate monthly percent of an LME area affected by heatwave
Description of Time Series:
This time series shows the monthly heatwave spatial coverage for the Howland and Baker Islands Region. During the last five years there has been an increasing trend and the five-year average is between the 10th and 90th percentiles of all observed data in the time series.
Indicator Source Information:
The marine heatwave data shown here are calculated by NOAA’s National Centers for Environmental Information using Optimum Interpolation Sea Surface Temperature (OISST) data. The NOAA 1/4° OISST is a long term Climate Data Record that incorporates observations from different platforms (satellites, ships, buoys and Argo floats) into a regular global grid. The dataset is interpolated to fill gaps on the grid and create a spatially complete map of sea surface temperature. Satellite and ship observations are referenced to buoys to compensate for platform differences and sensor biases.
Data Background and Caveats:
Heatwave metrics are calculated using OISST, a product that uses some forms of interpolation to fill data gaps. Heatwaves are defined by Hobday et al., 2016 as distinct events where SST anomaly reaches the 90th percentile in a pixel for at least 5 days, separated out by 3 or more days.
Jarvis Island Heatwave Area
During the last five years there has been a significant increasing trend and the five-year average is between the 10th and 90th percentiles of all observed data in the time series.
Values indicate monthly percent of an LME area affected by heatwave
Description of Time Series:
This time series shows the monthly heatwave spatial coverage for the Jarvis Island Region. During the last five years there has been a significant increasing trend and the five-year average is between the 10th and 90th percentiles of all observed data in the time series.
Indicator Source Information:
The marine heatwave data shown here are calculated by NOAA’s National Centers for Environmental Information using Optimum Interpolation Sea Surface Temperature (OISST) data. The NOAA 1/4° OISST is a long term Climate Data Record that incorporates observations from different platforms (satellites, ships, buoys and Argo floats) into a regular global grid. The dataset is interpolated to fill gaps on the grid and create a spatially complete map of sea surface temperature. Satellite and ship observations are referenced to buoys to compensate for platform differences and sensor biases.
Data Background and Caveats:
Heatwave metrics are calculated using OISST, a product that uses some forms of interpolation to fill data gaps. Heatwaves are defined by Hobday et al., 2016 as distinct events where SST anomaly reaches the 90th percentile in a pixel for at least 5 days, separated out by 3 or more days.
Johnson Atoll Heatwave Area
During the last five years there has been no trend and the five-year average is between the 10th and 90th percentiles of all observed data in the time series.
Values indicate monthly percent of an LME area affected by heatwave
Description of Time Series:
This time series shows the monthly heatwave spatial coverage for the Johnson Atoll Region. During the last five years there has been no trend and the five-year average is between the 10th and 90th percentiles of all observed data in the time series.
Indicator Source Information:
The marine heatwave data shown here are calculated by NOAA’s National Centers for Environmental Information using Optimum Interpolation Sea Surface Temperature (OISST) data. The NOAA 1/4° OISST is a long term Climate Data Record that incorporates observations from different platforms (satellites, ships, buoys and Argo floats) into a regular global grid. The dataset is interpolated to fill gaps on the grid and create a spatially complete map of sea surface temperature. Satellite and ship observations are referenced to buoys to compensate for platform differences and sensor biases.
Data Background and Caveats:
Heatwave metrics are calculated using OISST, a product that uses some forms of interpolation to fill data gaps. Heatwaves are defined by Hobday et al., 2016 as distinct events where SST anomaly reaches the 90th percentile in a pixel for at least 5 days, separated out by 3 or more days.
Kingman Reef and Palmyra Atoll Heatwave Area
During the last five years there has been no trend and the five-year average is between the 10th and 90th percentiles of all observed data in the time series.
Values indicate monthly percent of an LME area affected by heatwave
Description of Time Series:
This time series shows the monthly heatwave spatial coverage for the Kingman Reef and Palmyra Atoll Region. During the last five years there has been no trend and the five-year average is between the 10th and 90th percentiles of all observed data in the time series.
Indicator Source Information:
The marine heatwave data shown here are calculated by NOAA’s National Centers for Environmental Information using Optimum Interpolation Sea Surface Temperature (OISST) data. The NOAA 1/4° OISST is a long term Climate Data Record that incorporates observations from different platforms (satellites, ships, buoys and Argo floats) into a regular global grid. The dataset is interpolated to fill gaps on the grid and create a spatially complete map of sea surface temperature. Satellite and ship observations are referenced to buoys to compensate for platform differences and sensor biases.
Data Background and Caveats:
Heatwave metrics are calculated using OISST, a product that uses some forms of interpolation to fill data gaps. Heatwaves are defined by Hobday et al., 2016 as distinct events where SST anomaly reaches the 90th percentile in a pixel for at least 5 days, separated out by 3 or more days.
Wake Island Heatwave Area
During the last five years there has been no trend and the five-year average is between the 10th and 90th percentiles of all observed data in the time series.
Values indicate monthly percent of an LME area affected by heatwave
Description of Time Series:
This time series shows the monthly heatwave spatial coverage for the Wake Island Region. During the last five years there has been no trend and the five-year average is between the 10th and 90th percentiles of all observed data in the time series.
Indicator Source Information:
The marine heatwave data shown here are calculated by NOAA’s National Centers for Environmental Information using Optimum Interpolation Sea Surface Temperature (OISST) data. The NOAA 1/4° OISST is a long term Climate Data Record that incorporates observations from different platforms (satellites, ships, buoys and Argo floats) into a regular global grid. The dataset is interpolated to fill gaps on the grid and create a spatially complete map of sea surface temperature. Satellite and ship observations are referenced to buoys to compensate for platform differences and sensor biases.
Data Background and Caveats:
Heatwave metrics are calculated using OISST, a product that uses some forms of interpolation to fill data gaps. Heatwaves are defined by Hobday et al., 2016 as distinct events where SST anomaly reaches the 90th percentile in a pixel for at least 5 days, separated out by 3 or more days.
Great Lakes Heatwave Area
During the last five years there has been no trend and the five-year average is between the 10th and 90th percentiles of all observed data in the time series.
Values indicate monthly percent of an LME area affected by heatwave
Description of Time Series:
This time series shows the monthly heatwave spatial coverage for the Great Lakes Region. During the last five years there has been no trend and the five-year average is between the 10th and 90th percentiles of all observed data in the time series.
Indicator Source Information:
The marine heatwave data shown here are calculated by NOAA’s National Centers for Environmental Information using Optimum Interpolation Sea Surface Temperature (OISST) data. The NOAA 1/4° OISST is a long term Climate Data Record that incorporates observations from different platforms (satellites, ships, buoys and Argo floats) into a regular global grid. The dataset is interpolated to fill gaps on the grid and create a spatially complete map of sea surface temperature. Satellite and ship observations are referenced to buoys to compensate for platform differences and sensor biases.
Data Background and Caveats:
Heatwave metrics are calculated using OISST, a product that uses some forms of interpolation to fill data gaps. Heatwaves are defined by Hobday et al., 2016 as distinct events where SST anomaly reaches the 90th percentile in a pixel for at least 5 days, separated out by 3 or more days.
Lake Ontario Heatwave Area
During the last five years there has been no trend and the five-year average is between the 10th and 90th percentiles of all observed data in the time series.
Values indicate monthly percent of an LME area affected by heatwave
Description of Time Series:
This time series shows the monthly heatwave spatial coverage for the Lake Ontario Region. During the last five years there has been no trend and the five-year average is between the 10th and 90th percentiles of all observed data in the time series.
Indicator Source Information:
The marine heatwave data shown here are calculated by NOAA’s National Centers for Environmental Information using Optimum Interpolation Sea Surface Temperature (OISST) data. The NOAA 1/4° OISST is a long term Climate Data Record that incorporates observations from different platforms (satellites, ships, buoys and Argo floats) into a regular global grid. The dataset is interpolated to fill gaps on the grid and create a spatially complete map of sea surface temperature. Satellite and ship observations are referenced to buoys to compensate for platform differences and sensor biases.
Data Background and Caveats:
Heatwave metrics are calculated using OISST, a product that uses some forms of interpolation to fill data gaps. Heatwaves are defined by Hobday et al., 2016 as distinct events where SST anomaly reaches the 90th percentile in a pixel for at least 5 days, separated out by 3 or more days.
Lake Erie Heatwave Area
During the last five years there has been no trend and the five-year average is between the 10th and 90th percentiles of all observed data in the time series.
Values indicate monthly percent of an LME area affected by heatwave
Description of Time Series:
This time series shows the monthly heatwave spatial coverage for the Lake Erie Region. During the last five years there has been no trend and the five-year average is between the 10th and 90th percentiles of all observed data in the time series.
Indicator Source Information:
The marine heatwave data shown here are calculated by NOAA’s National Centers for Environmental Information using Optimum Interpolation Sea Surface Temperature (OISST) data. The NOAA 1/4° OISST is a long term Climate Data Record that incorporates observations from different platforms (satellites, ships, buoys and Argo floats) into a regular global grid. The dataset is interpolated to fill gaps on the grid and create a spatially complete map of sea surface temperature. Satellite and ship observations are referenced to buoys to compensate for platform differences and sensor biases.
Data Background and Caveats:
Heatwave metrics are calculated using OISST, a product that uses some forms of interpolation to fill data gaps. Heatwaves are defined by Hobday et al., 2016 as distinct events where SST anomaly reaches the 90th percentile in a pixel for at least 5 days, separated out by 3 or more days.
Lake Huron Heatwave Area
During the last five years there has been no trend and the five-year average is above the 90th percentile of all observed data in the time series.
Values indicate monthly percent of an LME area affected by heatwave
Description of Time Series:
This time series shows the monthly heatwave spatial coverage for the Lake Huron Region. During the last five years there has been no trend and the five-year average is above the 90th percentile of all observed data in the time series.
Indicator Source Information:
The marine heatwave data shown here are calculated by NOAA’s National Centers for Environmental Information using Optimum Interpolation Sea Surface Temperature (OISST) data. The NOAA 1/4° OISST is a long term Climate Data Record that incorporates observations from different platforms (satellites, ships, buoys and Argo floats) into a regular global grid. The dataset is interpolated to fill gaps on the grid and create a spatially complete map of sea surface temperature. Satellite and ship observations are referenced to buoys to compensate for platform differences and sensor biases.
Data Background and Caveats:
Heatwave metrics are calculated using OISST, a product that uses some forms of interpolation to fill data gaps. Heatwaves are defined by Hobday et al., 2016 as distinct events where SST anomaly reaches the 90th percentile in a pixel for at least 5 days, separated out by 3 or more days.
Lake Michigan Heatwave Area
During the last five years there has been no trend and the five-year average is between the 10th and 90th percentiles of all observed data in the time series.
Values indicate monthly percent of an LME area affected by heatwave
Description of Time Series:
This time series shows the monthly heatwave spatial coverage for the Lake Michigan Region. During the last five years there has been no trend and the five-year average is between the 10th and 90th percentiles of all observed data in the time series.
Indicator Source Information:
The marine heatwave data shown here are calculated by NOAA’s National Centers for Environmental Information using Optimum Interpolation Sea Surface Temperature (OISST) data. The NOAA 1/4° OISST is a long term Climate Data Record that incorporates observations from different platforms (satellites, ships, buoys and Argo floats) into a regular global grid. The dataset is interpolated to fill gaps on the grid and create a spatially complete map of sea surface temperature. Satellite and ship observations are referenced to buoys to compensate for platform differences and sensor biases.
Data Background and Caveats:
Heatwave metrics are calculated using OISST, a product that uses some forms of interpolation to fill data gaps. Heatwaves are defined by Hobday et al., 2016 as distinct events where SST anomaly reaches the 90th percentile in a pixel for at least 5 days, separated out by 3 or more days.
Lake Superior Heatwave Area
During the last five years there has been no trend and the five-year average is between the 10th and 90th percentiles of all observed data in the time series.
Values indicate monthly percent of an LME area affected by heatwave
Description of Time Series:
This time series shows the monthly heatwave spatial coverage for the Lake Superior Region. During the last five years there has been no trend and the five-year average is between the 10th and 90th percentiles of all observed data in the time series.
Indicator Source Information:
The marine heatwave data shown here are calculated by NOAA’s National Centers for Environmental Information using Optimum Interpolation Sea Surface Temperature (OISST) data. The NOAA 1/4° OISST is a long term Climate Data Record that incorporates observations from different platforms (satellites, ships, buoys and Argo floats) into a regular global grid. The dataset is interpolated to fill gaps on the grid and create a spatially complete map of sea surface temperature. Satellite and ship observations are referenced to buoys to compensate for platform differences and sensor biases.
Data Background and Caveats:
Heatwave metrics are calculated using OISST, a product that uses some forms of interpolation to fill data gaps. Heatwaves are defined by Hobday et al., 2016 as distinct events where SST anomaly reaches the 90th percentile in a pixel for at least 5 days, separated out by 3 or more days.
Beaufort Sea Heatwave Area
During the last five years there has been no trend and the five-year average is between the 10th and 90th percentiles of all observed data in the time series.
Values indicate monthly percent of an LME area affected by heatwave
Description of Time Series:
This time series shows the monthly heatwave spatial coverage for the Beaufort Sea Region. During the last five years there has been no trend and the five-year average is between the 10th and 90th percentiles of all observed data in the time series.
Indicator Source Information:
The marine heatwave data shown here are calculated by NOAA’s National Centers for Environmental Information using Optimum Interpolation Sea Surface Temperature (OISST) data. The NOAA 1/4° OISST is a long term Climate Data Record that incorporates observations from different platforms (satellites, ships, buoys and Argo floats) into a regular global grid. The dataset is interpolated to fill gaps on the grid and create a spatially complete map of sea surface temperature. Satellite and ship observations are referenced to buoys to compensate for platform differences and sensor biases.
Data Background and Caveats:
Heatwave metrics are calculated using OISST, a product that uses some forms of interpolation to fill data gaps. Heatwaves are defined by Hobday et al., 2016 as distinct events where SST anomaly reaches the 90th percentile in a pixel for at least 5 days, separated out by 3 or more days.

Additional Resources
NOAA PSL Marine Heatwaves
Scientists at PSL are working to characterize marine heatwaves, understand how they form and dissipate, and predict them in advance. On this page, we will provide current ocean maps, forecasts of heatwaves, interactive tools for users to explore ocean heatwaves themselves, links to research results and to webpages at other institutions.

The California Current Marine Heatwave Tracker - Blobtracker
Developed by oceanographers from NOAA Fisheries’ Southwest Fisheries Science Center as an experimental tool for natural resource managers, the California Current MHW Tracker is a program designed to understand, describe, and provide a historical context for the 2014-16 blob.2 It also produces a range of indices that could help forecast or predict future MHWs expected to impact our coast.
