
Description of billion-dollar disasters:
In the United States, the number of weather and climate-related disasters exceeding $1 billion has been increasing since 1980. These events have significant impacts to coastal economies and communities. The Billion Dollar Disaster indicator provides information on the frequency and the total estimated costs of major weather and climate events that occur in the United States. This indicator compiles the annual number of weather and climate-related disasters across seven event types (drought/heatwave, severe storm, tornado, wildfire, flood, freeze and winter storm/coldwave). We present the total annual number of disaster events for all regions.
Data Source:
Billion dollar disaster event frequency data are taken from NOAA’s National Centers for Environmental Information. For the most up to date data, please visit the original source linked above.
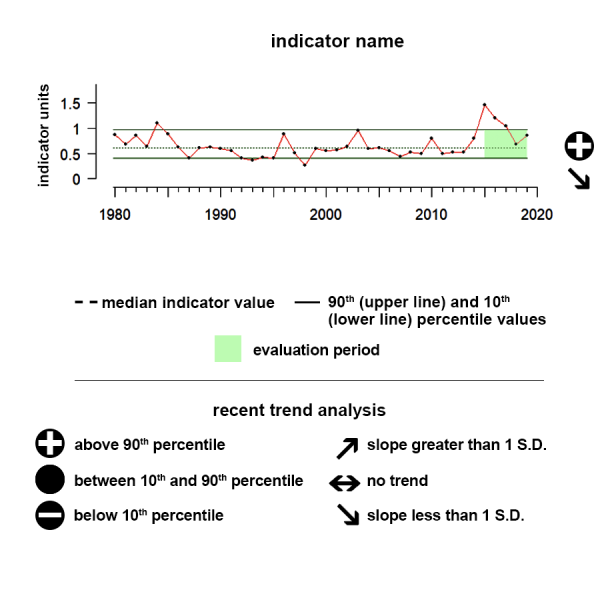
Understanding the Time series plots
Time series plots show the changes in each indicator as a function of time, over the period 1980-present. Each plot also shows horizontal lines that indicate the median (middle) value of that indicator, as well as the 10th and 90th percentiles, each calculated for the entire period of measurement. Time series plots were only developed for datasets with at least 10 years of data. Two symbols located to the right of each plot describe how recent values of an indicator compare against the overall series. A black circle indicates whether the indicator values over the last five years are on average above the series 90th percentile (plus sign), below the 10th percentile (minus sign), or between those two values (solid circle). Beneath that an arrow reflects the trend of the indicator over the last five years; an increase or decrease greater than one standard deviation is reflected in upward or downward arrows respectively, while a change of less than one standard deviation is recorded by a left-right arrow.
Alaska Billion Dollar Disasters
The last 5 years of data indicates the number of storms has begun to deviate from historical patterns of events, and there is a decreasing trend in the number of disasters.
Values correspond to the number of events in a given year
Time Series
Billion dollar disasters in Alaska only began to occur after 2000, but the last 5 years of data indicates the number of storms has begun to deviate from historical patterns of events, and there is a decreasing trend in the number of disasters.
Indicator Source Information:
Billion dollar disaster event frequency data are taken from NOAA’s National Centers for Environmental Information. The number of disasters within each region were summed for every year of available data. Although the number is the count of unique disaster events within a region, the same disaster can impact multiple regions, meaning a sum across regions will overestimate the unique number of disasters.
Data Background and Caveats:
Events are included if they are estimated to cause more than one billion U.S. dollars in direct losses. The cost estimates of these events are adjusted for inflation using the Consumer Price Index (CPI) and are based on costs documented in several Federal and private-sector databases.
Hawai'i Billion Dollar Disasters
There is no trend in the number of billion dollar disasters in Hawai'i.
Values correspond to the number of events in a given year. Note that this metric was calculated before the wildfires in Maui.
Time Series
Billion dollar disasters in Hawaii are infrequent, with only one disaster of that magnitude being recorded between 1980 and 2023. There is no trend in the number of disasters.
Indicator Source Information:
Billion dollar disaster event frequency data are taken from NOAA’s National Centers for Environmental Information. The number of disasters within each region were summed for every year of available data. Although the number is the count of unique disaster events within a region, the same disaster can impact multiple regions, meaning a sum across regions will overestimate the unique number of disasters.
Data Background and Caveats:
Events are included if they are estimated to cause more than one billion U.S. dollars in direct losses. The cost estimates of these events are adjusted for inflation using the Consumer Price Index (CPI) and are based on costs documented in several Federal and private-sector databases.
California Current Billion Dollar Disasters
The number of disasters over the past 5 years is substantially higher than historical levels of events, and there is a significant increasing trend in the number of events.
Values correspond to the number of events in a given year
Time Series
The number of billion dollar disasters within the California Current ecosystem is quite variable over time, generally fluctuating between zero and four disasters a year. The number of disasters over the past 5 years is substantially higher than historical levels of events, and there is a significant increasing trend in the number of events.
Indicator Source Information:
Billion dollar disaster event frequency data are taken from NOAA’s National Centers for Environmental Information. The number of disasters within each region were summed for every year of available data. Although the number is the count of unique disaster events within a region, the same disaster can impact multiple regions, meaning a sum across regions will overestimate the unique number of disasters.
Data Background and Caveats:
Events are included if they are estimated to cause more than one billion U.S. dollars in direct losses. The cost estimates of these events are adjusted for inflation using the Consumer Price Index (CPI) and are based on costs documented in several Federal and private-sector databases.
Gulf of America Billion Dollar Disasters
The number of disasters over the past 5 years is substantially higher than historical levels of events and is trending upwards.
Values correspond to the number of events in a given year
Time Series
The number of billion dollar disasters along the Gulf of America is variable over time. The number of disasters over the past 5 years is substantially higher than historical levels of events and is trending upwards.
Indicator Source Information:
Billion dollar disaster event frequency data are taken from NOAA’s National Centers for Environmental Information. The number of disasters within each region were summed for every year of available data. Although the number is the count of unique disaster events within a region, the same disaster can impact multiple regions, meaning a sum across regions will overestimate the unique number of disasters.
Data Background and Caveats:
Events are included if they are estimated to cause more than one billion U.S. dollars in direct losses. The cost estimates of these events are adjusted for inflation using the Consumer Price Index (CPI) and are based on costs documented in several Federal and private-sector databases.
US Caribbean Billion Dollar Disasters
The number of Billion dollar disasters in the Caribbean in the last 5 years has no trend and is similar to historical levels.
Values correspond to the number of events in a given year
Time Series
The number of Billion dollar disasters in the Caribbean in the last 5 years has no trend and is similar to historical levels.
Indicator Source Information:
Billion dollar disaster event frequency data are taken from NOAA’s National Centers for Environmental Information. The number of disasters within each region were summed for every year of available data. Although the number is the count of unique disaster events within a region, the same disaster can impact multiple regions, meaning a sum across regions will overestimate the unique number of disasters.
Data Background and Caveats:
Events are included if they are estimated to cause more than one billion U.S. dollars in direct losses. The cost estimates of these events are adjusted for inflation using the Consumer Price Index (CPI) and are based on costs documented in several Federal and private-sector databases.
Southeast Billion Dollar Disasters
The number of disasters over the past 5 years is substantially higher than historical levels of events, and there is an upward trend in the number of events.
Values correspond to the number of events in a given year
Time Series
The number of billion dollar disasters within the Southeast is variable over time. The number of disasters over the past 5 years is substantially higher than historical levels of events, and there is an upward trend in the number of events.
Indicator Source Information:
Billion dollar disaster event frequency data are taken from NOAA’s National Centers for Environmental Information. The number of disasters within each region were summed for every year of available data. Although the number is the count of unique disaster events within a region, the same disaster can impact multiple regions, meaning a sum across regions will overestimate the unique number of disasters.
Data Background and Caveats:
Events are included if they are estimated to cause more than one billion U.S. dollars in direct losses. The cost estimates of these events are adjusted for inflation using the Consumer Price Index (CPI) and are based on costs documented in several Federal and private-sector databases.
Northeast Billion Dollar Disasters
The number of disasters over the past 5 years is substantially higher than historical levels of events, but there is no trend in the number of events.
Values correspond to the number of events in a given year
Time Series
The number of billion dollar disasters within the Northeast is variable over time. The number of disasters over the past 5 years is substantially higher than historical levels of events, but there is no trend in the number of events.
Indicator Source Information:
Billion dollar disaster event frequency data are taken from NOAA’s National Centers for Environmental Information. The number of disasters within each region were summed for every year of available data. Although the number is the count of unique disaster events within a region, the same disaster can impact multiple regions, meaning a sum across regions will overestimate the unique number of disasters.
Data Background and Caveats:
Events are included if they are estimated to cause more than one billion U.S. dollars in direct losses. The cost estimates of these events are adjusted for inflation using the Consumer Price Index (CPI) and are based on costs documented in several Federal and private-sector databases.
Source and analysis of data:
Billion dollar disaster event frequency data are taken from NOAA’s National Centers for Environmental Information. The number of disasters within each region were summed for every year of available data. Although the number is the count of unique disaster events within a region, the same disaster can impact multiple regions, meaning a sum across regions will overestimate the unique number of disasters.
US Great Lakes Billion Dollar Disasters
The number of disasters over the past 5 years is substantially higher than historical levels of events, and there is an upward trend in the number of events.
Values correspond to the number of events in a given year
Time Series
The number of billion dollar disasters within the Great Lakes is variable over time. The number of disasters over the past 5 years is substantially higher than historical levels of events, and there is an upward trend in the number of events.
Indicator Source Information:
Billion dollar disaster event frequency data are taken from NOAA’s National Centers for Environmental Information. The number of disasters within each region were summed for every year of available data. Although the number is the count of unique disaster events within a region, the same disaster can impact multiple regions, meaning a sum across regions will overestimate the unique number of disasters.
Data Background and Caveats:
Events are included if they are estimated to cause more than one billion U.S. dollars in direct losses. The cost estimates of these events are adjusted for inflation using the Consumer Price Index (CPI) and are based on costs documented in several Federal and private-sector databases.

Resources
NCEI: Billion-Dollar Weather and Climate Disasters
The site provides a table of U.S. billion-dollar disaster events including summaries, report links, and statistics.

2022 Billion Dollar Disasters Map
In 2022, the United States experienced 18 separate weather or climate disasters that each resulted in at least $1 billion in damages. NOAA map by NCEI.
Environmental Response Management Application (ERMA)
The Environmental Response Management Application (ERMA®) is an online mapping tool that integrates both static and real-time data, such as Environmental Sensitivity Index (ESI) maps, ship locations, weather, and ocean currents, in a centralized, easy-to-use format for environmental responders and decision makers. ERMA enables a user to quickly and securely upload, analyze, export, and display spatial data in a Geographic Information System (GIS) map. Developed by NOAA and the University of New Hampshire(link is external) with the U.S. Environmental Protection Agency, U.S. Coast Guard, and U.S. Department of the Interior, ERMA provides environmental resource managers with the data necessary to make informed decisions for environmental response.
