
Description of Sea Level:
Global sea level has been rising over the past century, with increasing rates in recent decades driven primarily by warming of the ocean (since water expands as it warms) and by increased melting of land-based ice, such as glaciers and ice sheets. Local and regional sea-level change may be more or less than the global average due to local factors such as land subsidence, changes in regional ocean currents, and whether the land is still rebounding from the compressive weight of Ice Age glaciers.
With 40 percent of Americans living in densely populated coastal areas, having a clear understanding of sea level trends is critical to societal and economic well being. Measuring and predicting sea levels, tides and storm surge are important for determining coastal boundaries, ensuring safe shipping, and emergency preparedness, etc. NOAA monitors sea levels using tide stations and satellite laser altimeters. Tide stations around the globe tell us what is happening at local levels, while satellite measurements provide us with the average height of the entire ocean. Taken together, data from these sources are fed into models that tell us how our ocean sea levels are changing over time. For this site, data from tide stations around the US were combined to create regionally averaged records of sea-level change since 1980. We present data for all regions.
Water levels of the Great Lakes fluctuate dramatically in response to a variety of factors. The lakes have experienced record high levels in 2019 and 2020, less than a decade after an extended period of low water ending in 2013—showcasing the dramatic changes water levels can experience from year to year. Changing water levels can impact water dependent industries such as shipping, fisheries, tourism, and coastal infrastructure including coastal roads, piers, and wetlands.
Great Lakes water levels are continuously monitored by U.S. and Canadian federal agencies in the region through a binational partnership. Water level monitoring stations are operated by NOAA's Center for Operational Oceanographic Products and Services (CO-OPS) and the Department of Fisheries and Oceans' Canadian Hydrographic Service. The U.S. Army Corps of Engineers (Detroit, Chicago, Buffalo) and Environment and Climate Change Canada play crucial roles in research, coordination of data and operational seasonal water level forecasts for the basin.
Data Source:
Sea level data presented here are measurements of relative sea level, water height as compared to nearby land level, from NOAA tide gauges that have >20 years of hourly data served through NOAA’s Center for Operational Oceanographic Products and Services (CO-OPS) Tides and Currents website.
Great Lakes data come from this link and this link.
For the most up to date data, please reference the original source above.
Understanding the Time series plots
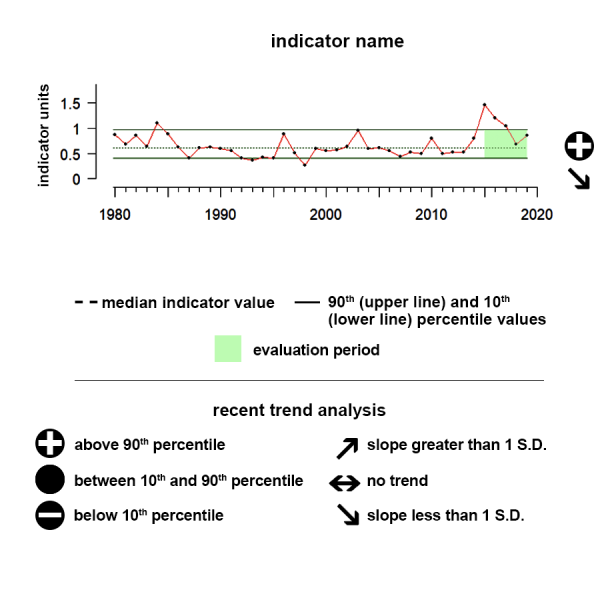
Time series plots show the changes in each indicator as a function of time, over the period 1980-present. Each plot also shows horizontal lines that indicate the median (middle) value of that indicator, as well as the 10th and 90th percentiles, each calculated for the entire period of measurement. Time series plots were only developed for datasets with at least 10 years of data. Two symbols located to the right of each plot describe how recent values of an indicator compare against the overall series. A black circle indicates whether the indicator values over the last five years are on average above the series 90th percentile (plus sign), below the 10th percentile (minus sign), or between those two values (solid circle). Beneath that an arrow reflects the trend of the indicator over the last five years; an increase or decrease greater than one standard deviation is reflected in upward or downward arrows respectively, while a change of less than one standard deviation is recorded by a left-right arrow.
Northern Alaska Sea Level
During the last five years, there has been a decreasing trend and values are between the 10th and 90th percentiles.
Sea level varies due to the force of gravity, the Earth’s rotation and irregular features on the ocean floor. Other forces affecting sea levels include temperature, wind, ocean currents, tides, and other similar processes.
Description of time series:
The time series shows the relative sea level for this region. During the last five years, there has been a decreasing trend and values are between the 10th and 90th percentiles.
Indicator and source information:
NOAA monitors sea levels using tide stations and satellite laser altimeters. Tide stations around the globe tell us what is happening at local levels, while satellite measurements provide us with the average height of the entire ocean. Taken together, data from these sources are fed into models that tell us how our ocean sea levels are changing over time. For this site, data from tide stations around the US were combined to create regionally averaged records of sea-level change since 1980. We present data for all regions.
This indicator includes tide gauges from Nome and Prudhoe Bay, AK.
Data background and limitations:
Sea level data presented here are measurements of relative sea level, water height as compared to nearby land level, from NOAA tide gauges that have >20 years of hourly data served through NOAA’s Center for Operational Oceanographic Products and Services (CO-OPS) Tides and Currents website. These local measurements are regionally averaged by taking the median value of all the qualifying stations within a region. The measurements are in meters and are relative to the year 2000.
Southern Alaska Sea Level
During the last five years, there has been no trend yet values are below the 10th percentile.
Sea level varies due to the force of gravity, the Earth’s rotation and irregular features on the ocean floor. Other forces affecting sea levels include temperature, wind, ocean currents, tides, and other similar processes.
Description of time series:
The time series shows the relative sea level for this region. During the last five years, there has been no trend yet values are below the 10th percentile.
Indicator and source information:
NOAA monitors sea levels using tide stations and satellite laser altimeters. Tide stations around the globe tell us what is happening at local levels, while satellite measurements provide us with the average height of the entire ocean. Taken together, data from these sources are fed into models that tell us how our ocean sea levels are changing over time. For this site, data from tide stations around the US were combined to create regionally averaged records of sea-level change since 1980. We present data for all regions.
This indicator includes tide gauges from Ketchikan, Sitka, Juneau, Skagway, Yakutat, Cordova, Valdez, Seward, Seldovia, Nikiski, Anchorage, Kodiak Island, Sand Point, Adak Island, Unalaska, and Port Moller, AK.
Data background and limitations:
Sea level data presented here are measurements of relative sea level, water height as compared to nearby land level, from NOAA tide gauges that have >20 years of hourly data served through NOAA’s Center for Operational Oceanographic Products and Services (CO-OPS) Tides and Currents website. These local measurements are regionally averaged by taking the median value of all the qualifying stations within a region. The measurements are in meters and are relative to the year 2000.
Hawai'i Sea Level
During the last five years, there has been no trend and values are between the 10th and 90th percentile of all observed data in the time series.
Sea level varies due to the force of gravity, the Earth’s rotation and irregular features on the ocean floor. Other forces affecting sea levels include temperature, wind, ocean currents, tides, and other similar processes.
Description of time series:
The time series shows the relative sea level for this region. During the last five years, there has been no trend and values are between the 10th and 90th percentile of all observed data in the time series.
Data background and limitations:
Sea level data presented here are measurements of relative sea level, water height as compared to nearby land level, from NOAA tide gauges that have >20 years of hourly data served through NOAA’s Center for Operational Oceanographic Products and Services (CO-OPS) Tides and Currents website. These local measurements are regionally averaged by taking the median value of all the qualifying stations within a region. The measurements are in meters and are relative to the year 2000.
California Current Sea Level
During the last five years, there has been no trend and values are between the 10th and 90th percentiles of all data.
Sea level varies due to the force of gravity, the Earth’s rotation and irregular features on the ocean floor. Other forces affecting sea levels include temperature, wind, ocean currents, tides, and other similar processes.
Description of time series:
The time series shows the relative sea level for this region. During the last five years, there has been no trend and values are between the 10th and 90th percentiles of all data.
Indicator and source information:
NOAA monitors sea levels using tide stations and satellite laser altimeters. Tide stations around the globe tell us what is happening at local levels, while satellite measurements provide us with the average height of the entire ocean. Taken together, data from these sources are fed into models that tell us how our ocean sea levels are changing over time. For this site, data from tide stations around the US were combined to create regionally averaged records of sea-level change since 1980. We present data for all regions.
Data background and limitations:
Sea level data presented here are measurements of relative sea level, water height as compared to nearby land level, from NOAA tide gauges that have >20 years of hourly data served through NOAA’s Center for Operational Oceanographic Products and Services (CO-OPS) Tides and Currents website. These local measurements are regionally averaged by taking the median value of all the qualifying stations within a region. The measurements are in meters and are relative to the year 2000.
Gulf of America Sea Level
During the last five years, there has been no trend and values are greater than 90% of all observed data in the time series.
Sea level varies due to the force of gravity, the Earth’s rotation and irregular features on the ocean floor. Other forces affecting sea levels include temperature, wind, ocean currents, tides, and other similar processes.
Description of time series:
The time series shows the relative sea level for this region. During the last five years, there has been no trend and values are greater than 90% of all observed data in the time series.
Indicator and source information:
NOAA monitors sea levels using tide stations and satellite laser altimeters. Tide stations around the globe tell us what is happening at local levels, while satellite measurements provide us with the average height of the entire ocean. Taken together, data from these sources are fed into models that tell us how our ocean sea levels are changing over time. For this site, data from tide stations around the US were combined to create regionally averaged records of sea-level change since 1980. We present data for all regions.
Data background and limitations:
Sea level data presented here are measurements of relative sea level, water height as compared to nearby land level, from NOAA tide gauges that have >20 years of hourly data served through NOAA’s Center for Operational Oceanographic Products and Services (CO-OPS) Tides and Currents website. These local measurements are regionally averaged by taking the median value of all the qualifying stations within a region. The measurements are in meters and are relative to the year 2000.
US Caribbean Sea Level
During the last five years, there has been no trend and values between the 10th and 90th percentiles of all data.
Sea level varies due to the force of gravity, the Earth’s rotation and irregular features on the ocean floor. Other forces affecting sea levels include temperature, wind, ocean currents, tides, and other similar processes.
Description of time series:
The time series shows the relative sea level for this region. During the last five years, there has been no trend and values between the 10th and 90th percentiles of all data.
Indicator and source information:
NOAA monitors sea levels using tide stations and satellite laser altimeters. Tide stations around the globe tell us what is happening at local levels, while satellite measurements provide us with the average height of the entire ocean. Taken together, data from these sources are fed into models that tell us how our ocean sea levels are changing over time. For this site, data from tide stations around the US were combined to create regionally averaged records of sea-level change since 1980. We present data for all regions.
Data background and limitations:
Sea level data presented here are measurements of relative sea level, water height as compared to nearby land level, from NOAA tide gauges that have >20 years of hourly data served through NOAA’s Center for Operational Oceanographic Products and Services (CO-OPS) Tides and Currents website. These local measurements are regionally averaged by taking the median value of all the qualifying stations within a region. The measurements are in meters and are relative to the year 2000.
Southeast Sea Level
During the last five years, there has been no trend but values are greater than 90% of all observed data in the time series.
Sea level varies due to the force of gravity, the Earth’s rotation and irregular features on the ocean floor. Other forces affecting sea levels include temperature, wind, ocean currents, tides, and other similar processes.
Description of time series:
The time series shows the relative sea level for this region. During the last five years, there has been no trend but values are greater than 90% of all observed data in the time series.
Indicator and source information:
NOAA monitors sea levels using tide stations and satellite laser altimeters. Tide stations around the globe tell us what is happening at local levels, while satellite measurements provide us with the average height of the entire ocean. Taken together, data from these sources are fed into models that tell us how our ocean sea levels are changing over time. For this site, data from tide stations around the US were combined to create regionally averaged records of sea-level change since 1980. We present data for all regions.
Data background and limitations:
Sea level data presented here are measurements of relative sea level, water height as compared to nearby land level, from NOAA tide gauges that have >20 years of hourly data served through NOAA’s Center for Operational Oceanographic Products and Services (CO-OPS) Tides and Currents website. These local measurements are regionally averaged by taking the median value of all the qualifying stations within a region. The measurements are in meters and are relative to the year 2000.
Northeast Sea Level
During the last five years, there has been no trend and values are greater than 90% of all observed data in the time series.
Sea level varies due to the force of gravity, the Earth’s rotation and irregular features on the ocean floor. Other forces affecting sea levels include temperature, wind, ocean currents, tides, and other similar processes.
Description of time series:
The time series shows the relative sea level for this region. During the last five years, there has been no trend and values are greater than 90% of all observed data in the time series.
Indicator and source information:
NOAA monitors sea levels using tide stations and satellite laser altimeters. Tide stations around the globe tell us what is happening at local levels, while satellite measurements provide us with the average height of the entire ocean. Taken together, data from these sources are fed into models that tell us how our ocean sea levels are changing over time. For this site, data from tide stations around the US were combined to create regionally averaged records of sea-level change since 1980. We present data for all regions.
Data background and limitations:
Sea level data presented here are measurements of relative sea level, water height as compared to nearby land level, from NOAA tide gauges that have >20 years of hourly data served through NOAA’s Center for Operational Oceanographic Products and Services (CO-OPS) Tides and Currents website. These local measurements are regionally averaged by taking the median value of all the qualifying stations within a region. The measurements are in meters and are relative to the year 2000.
Lake Ontario Level
During the last five years, there has been a significant downward trend but values are between the 90th and 10th percentiles of all observed data in the time series.
Sea level varies due to the force of gravity, the Earth’s rotation and irregular features on the ocean floor. Other forces affecting sea levels include temperature, wind, ocean currents, tides, and other similar processes.
Description of time series:
The time series shows the relative lake level for this region. During the last five years, there has been a significant downward trend but values are between the 90th and 10th percentiles of all observed data in the time series.
Indicator and source information:
Water levels of the Great Lakes fluctuate dramatically in response to a variety of factors. The lakes have experienced record high levels in 2019 and 2020, less than a decade after an extended period of low water ending in 2013—showcasing the dramatic changes water levels can experience from year to year. Changing water levels can impact water dependent industries such as shipping, fisheries, tourism, and coastal infrastructure including coastal roads, piers, and wetlands.
Great Lakes water levels are continuously monitored by U.S. and Canadian federal agencies in the region through a binational partnership. Water level monitoring stations are operated by NOAA's Center for Operational Oceanographic Products and Services (CO-OPS) and the Department of Fisheries and Oceans' Canadian Hydrographic Service. The U.S. Army Corps of Engineers (Detroit, Chicago, Buffalo) and Environment and Climate Change Canada play crucial roles in research, coordination of data and operational seasonal water level forecasts for the basin
Data background and limitations:
Great Lakes data come from:https://www.glerl.noaa.gov/data/wlevels/#overview; and http://www.greatlakescc.org/wp36/
Lake Erie Level
During the last five years, there has been a significant downward trend and values were above the 90th percentile of all observed data in the time series.
Sea level varies due to the force of gravity, the Earth’s rotation and irregular features on the ocean floor. Other forces affecting sea levels include temperature, wind, ocean currents, tides, and other similar processes.
Description of time series:
The time series shows the relative lake level for this region. During the last five years, there has been a significant downward trend and values were above the 90th percentile of all observed data in the time series.
Indicator and source information:
Water levels of the Great Lakes fluctuate dramatically in response to a variety of factors. The lakes have experienced record high levels in 2019 and 2020, less than a decade after an extended period of low water ending in 2013—showcasing the dramatic changes water levels can experience from year to year. Changing water levels can impact water dependent industries such as shipping, fisheries, tourism, and coastal infrastructure including coastal roads, piers, and wetlands.
Great Lakes water levels are continuously monitored by U.S. and Canadian federal agencies in the region through a binational partnership. Water level monitoring stations are operated by NOAA's Center for Operational Oceanographic Products and Services (CO-OPS) and the Department of Fisheries and Oceans' Canadian Hydrographic Service. The U.S. Army Corps of Engineers (Detroit, Chicago, Buffalo) and Environment and Climate Change Canada play crucial roles in research, coordination of data and operational seasonal water level forecasts for the basin
Data background and limitations:
Great Lakes data come from:https://www.glerl.noaa.gov/data/wlevels/#overview; and http://www.greatlakescc.org/wp36/
Lake Superior Level
During the last five years there has been a significant downward trend and values were between the 10th and 90th percentiles of all observed data in the time series.
Sea level varies due to the force of gravity, the Earth’s rotation and irregular features on the ocean floor. Other forces affecting sea levels include temperature, wind, ocean currents, tides, and other similar processes.
Description of time series:
The time series shows the relative lake level for this region. During the last five years there has been a significant downward trend and values were between the 10th and 90th percentiles of all observed data in the time series.
Indicator and source information:
Water levels of the Great Lakes fluctuate dramatically in response to a variety of factors. The lakes have experienced record high levels in 2019 and 2020, less than a decade after an extended period of low water ending in 2013—showcasing the dramatic changes water levels can experience from year to year. Changing water levels can impact water dependent industries such as shipping, fisheries, tourism, and coastal infrastructure including coastal roads, piers, and wetlands.
Great Lakes water levels are continuously monitored by U.S. and Canadian federal agencies in the region through a binational partnership. Water level monitoring stations are operated by NOAA's Center for Operational Oceanographic Products and Services (CO-OPS) and the Department of Fisheries and Oceans' Canadian Hydrographic Service. The U.S. Army Corps of Engineers (Detroit, Chicago, Buffalo) and Environment and Climate Change Canada play crucial roles in research, coordination of data and operational seasonal water level forecasts for the basin
Data background and limitations:
Great Lakes data come from:https://www.glerl.noaa.gov/data/wlevels/#overview; and http://www.greatlakescc.org/wp36/
Lakes Michigan and Huron Levels
During the last five years, there has been a significant downward trend and values were between the 10th and the 90th percentile of all observed data in the time series.
Sea level varies due to the force of gravity, the Earth’s rotation and irregular features on the ocean floor. Other forces affecting sea levels include temperature, wind, ocean currents, tides, and other similar processes.
Description of time series:
The time series shows the relative lake level for this region. During the last five years, there has been a significant downward trend and values were between the 10th and the 90th percentile of all observed data in the time series.
Indicator and source information:
Water levels of the Great Lakes fluctuate dramatically in response to a variety of factors. The lakes have experienced record high levels in 2019 and 2020, less than a decade after an extended period of low water ending in 2013—showcasing the dramatic changes water levels can experience from year to year. Changing water levels can impact water dependent industries such as shipping, fisheries, tourism, and coastal infrastructure including coastal roads, piers, and wetlands.
Great Lakes water levels are continuously monitored by U.S. and Canadian federal agencies in the region through a binational partnership. Water level monitoring stations are operated by NOAA's Center for Operational Oceanographic Products and Services (CO-OPS) and the Department of Fisheries and Oceans' Canadian Hydrographic Service. The U.S. Army Corps of Engineers (Detroit, Chicago, Buffalo) and Environment and Climate Change Canada play crucial roles in research, coordination of data and operational seasonal water level forecasts for the basin
Data background and limitations:
Great Lakes data come from:https://www.glerl.noaa.gov/data/wlevels/#overview; and http://www.greatlakescc.org/wp36/

Resources
Sea Level Rise Viewer
Use this web mapping tool to visualize community-level impacts from coastal flooding or sea level rise (up to 10 feet above average high tides). Photo simulations of how future flooding might impact local landmarks are also provided, as well as data related to water depth, connectivity, flood frequency, socio-economic vulnerability, wetland loss and migration, and mapping confidence.

Sea Level Rise Data Download
The Digital Coast was developed to meet the unique needs of the coastal management community. The website provides not only coastal data, but also the tools, training, and information needed to make these data truly useful. Content comes from many sources, all of which are vetted by NOAA.
Data sets range from economic data to satellite imagery. The site contains visualization tools, predictive tools, and tools that make data easier to find and use. Training courses are available online or can be brought to the user’s location. Information is also organized by focus area or topic.

Sea Level Trends
The sea level trends measured by tide gauges that are presented here are local relative sea level (RSL) trends as opposed to the global sea level trend. Tide gauge measurements are made with respect to a local fixed reference on land. RSL is a combination of the sea level rise and the local vertical land motion. The global sea level trend has been recorded by satellite altimeters since 1992 and the latest global trend can be obtained from NOAA's Laboratory for Satellite Altimetry, with maps of the regional variation in the trend. The University of Colorado's Sea Level Research Group compares global sea level rates calculated by different research organizations and discusses some of the issues involved.

Global Climate Indicators
NOAA Climate.gov is a source of timely and authoritative scientific data and information about climate. Our goals are to promote public understanding of climate science and climate-related events, to make our data products and services easy to access and use, to provide climate-related support to the private sector and the Nation’s economy, and to serve people making climate-related decisions with tools and resources that help them answer specific questions.

Climate Change Indicators in the US (4th Edition)
EPA partners with more than 40 data contributors from various government agencies, academic institutions, and other organizations to compile a key set of indicators related to the causes and effects of climate change. The indicators are published in EPA's report, Climate Change Indicators in the United States, available on this website and in print. Explore the indicators below.

2022 Sea Level Rise Technical Report
This technical report provides a synthesis of the most recent science related to sea level rise, and serves as a key technical input for the Fifth National Climate Assessment that is underway. The report does not provide guidance or design specifications for a specific project, but is intended to help inform federal agencies, tribes, state and local governments, and stakeholders in coastal communities about current and future sea level rise. The executive summary provides key messages, and the body of the report provides detailed, technical information about the data, modeling, and analysis behind the report’s findings. As with the previous 2017 technical report, global mean sea level rise scenarios are regionalized for the U.S. coastline.
Data from the report are being incorporated into current and planned agency tools and services, and are immediately available in NOAA’s Sea Level Rise Viewer and NASA’s Task Force Projection Tool. Readers interested in accessing information for a particular community or region can look to these tools. In the coming months, a team of extension and engagement professionals with expertise on applying sea level rise to local level planning will be releasing a guide on applying and integrating the report into local planning and adaptation decisions; this guide will be available on the NOAA website.