The indicators on this website are sorted three ways: Thematically, Regionally, and as a National Status. The Regional pages are broken down at the "Large Marine Ecosystem" scale, as seen in the figure above.
(Click to enlarge)
This website is designed to provide users with an “at-a-glance” view of important ecosystem indicators at the large marine ecosystem and national scales. Thus, the website is broken into three main sections: Themes, Regions, and National.
For users interested in a specific type of indicator, the Themes menu allows you to select and view the indicators that exist within each of the thematic categories: Biological, Climatological, Physical-Chemical, and Human Dimension. Each page displays long-term time series for the indicator at the large marine ecosystem scale as well as gauges and arrows that display the indicator’s recent trends relative to the entire data set. More information can be found on the “Indicator Graphics” tab. Specific information about each indicator as well as plain language descriptions can be found by clicking on any time series graphic. Additionally, users can find more in-depth information about the indicators as well as download the data for themselves using the links in the Additional Resources section.
The Regional pages organize information for users interested in a specific area of the U.S. marine ecosystem. Each Regional page contains the same indicator information listed above for all indicators that could be identified for a given region. Regionally-specific resources are listed below, allowing users to identify organizations and data portals that work in their large marine ecosystem of interest. Finally, indicators that have data available for all regions are organized into a National Status that provides long-term time series and trends for a given indicator throughout the entire U.S. marine environment.
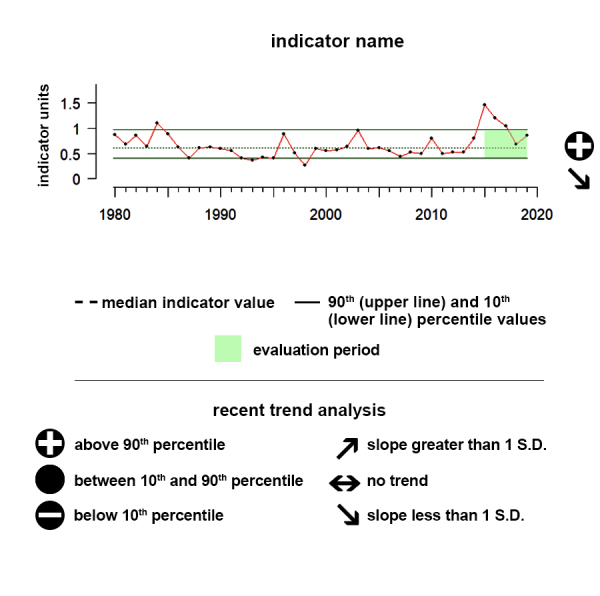
Understanding the Time series plots
Time series plots show the changes in each indicator as a function of time, over the period 1980-present. Each plot also shows horizontal lines that indicate the median (middle) value of that indicator, as well as the 10th and 90th percentiles, each calculated for the entire period of measurement. Time series plots were only developed for datasets with at least 10 years of data. Two symbols located to the right of each plot describe how recent values of an indicator compare against the overall series. A black circle indicates whether the indicator values over the last five years are on average above the series 90th percentile (plus sign), below the 10th percentile (minus sign), or between those two values (solid circle). Beneath that an arrow reflects the trend of the indicator over the last five years; an increase or decrease greater than one standard deviation is reflected in upward or downward arrows respectively, while a change of less than one standard deviation is recorded by a left-right arrow.
Disclaimer
The information on this website, including data and derived products, is intended for general informational purposes only. For legal compliance purposes, please consult the appropriate statutes and regulations. The information on this website does not replace or substitute for Regional Fishery Management Council decisions or National Marine Sanctuaries decisions, or any other National Oceanic and Atmospheric Administration policy or legal determinations.
Data License: Except where explicitly stated and shown, these data and derived products, were produced by NOAA and are not subject to copyright protection in the United States. NOAA waives any potential copyright and related rights in these data and derived products worldwide through the Creative Commons Zero 1.0 Universal Public Domain Dedication (CC0 1.0).
Data Quality: The Ecosystem Indicators Working Group follows standard procedures to review the quality of the data and derived products available through this site. These procedures are consistent with NOAA guidelines for pre-dissemination review, assessing the quality, integrity, and objectivity of data. In preparation of this site, every effort has been made to offer the most recent, up-to-date and accurate information possible. Nevertheless, inadvertent errors in information may occur. More detailed information on ecowatch.noaa data quality assurance processes is available upon request or on the ecowatch.noaa website.