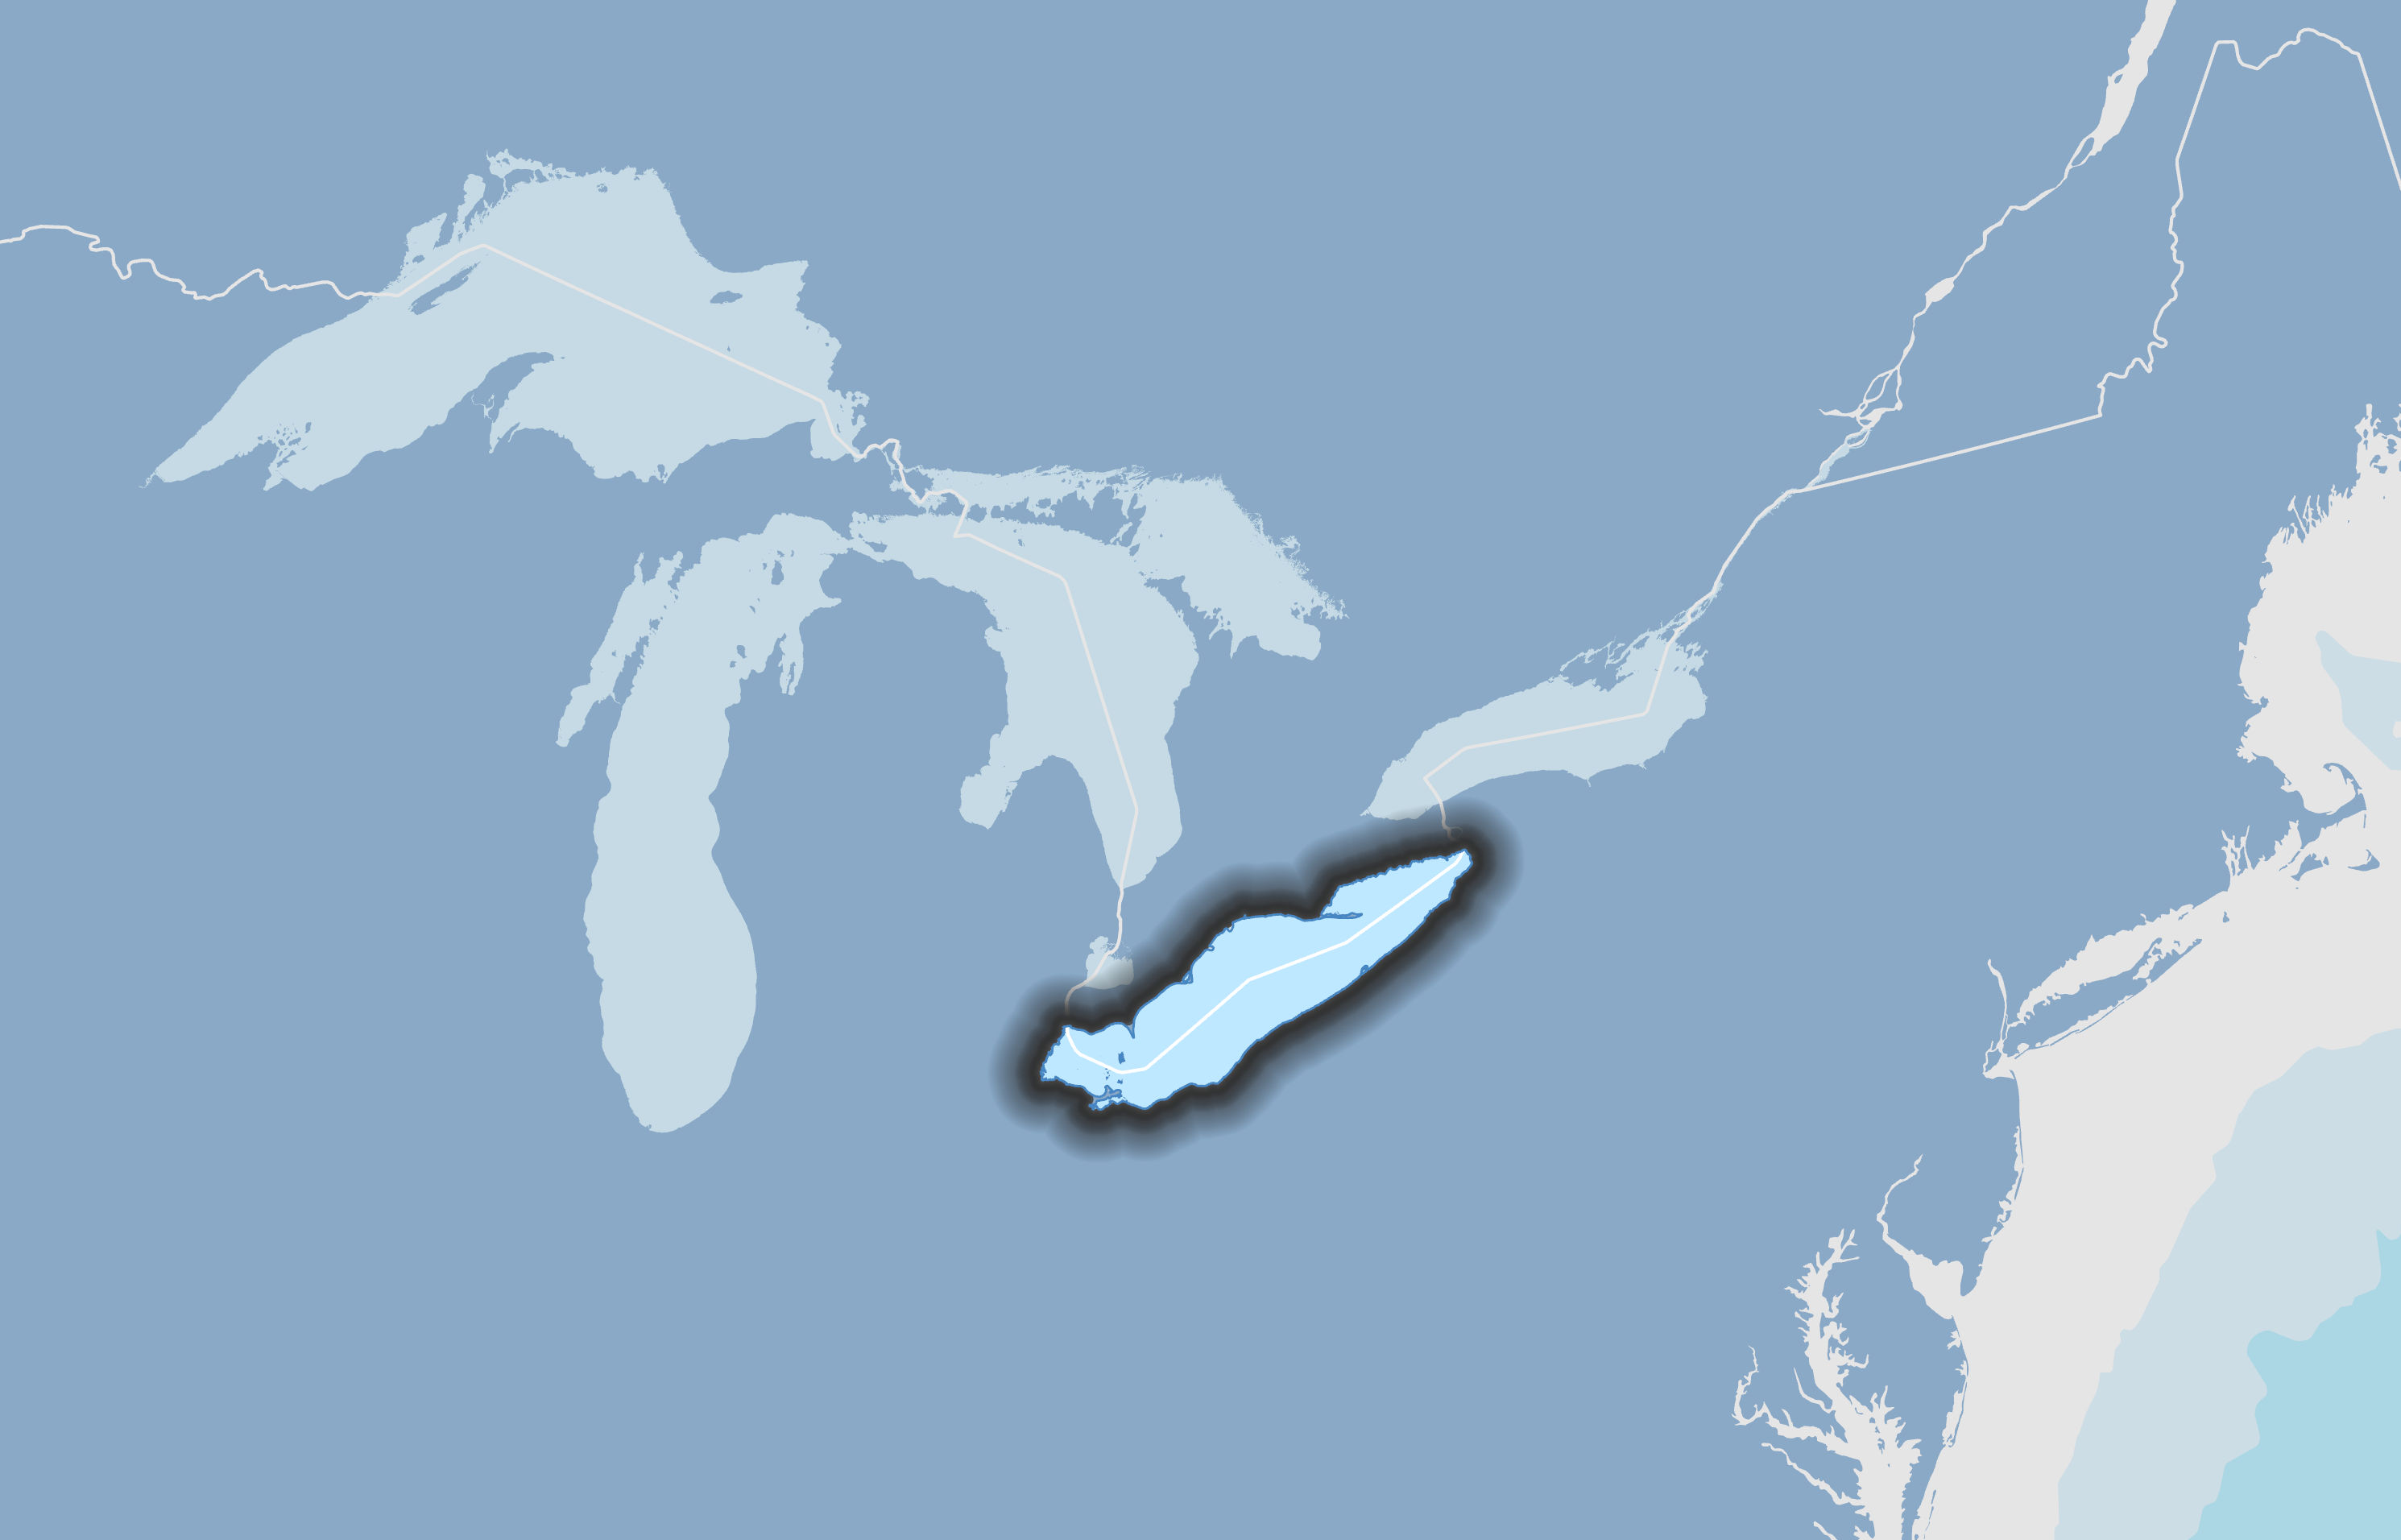
Lake Erie is the shallowest of the five Great Lakes with a maximum depth of 64 m or 210 ft. While only the fourth largest Great Lake with a water surface area of 25,655 square kilometers or 9,910 square miles. In the United States, about 10.5 million US residents live along Lake Erie and in Canada, roughly 1.9 million Canadians live near Lake Erie.
Understanding the Time series plots
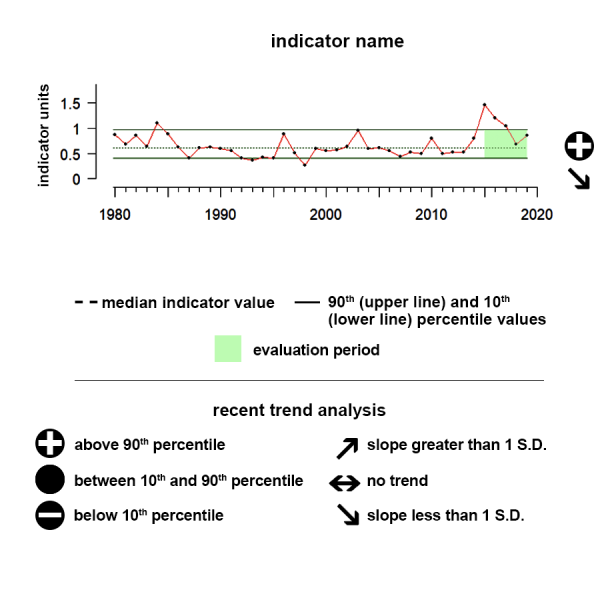
Time series plots show the changes in each indicator as a function of time, over the period 1980-present. Each plot also shows horizontal lines that indicate the median (middle) value of that indicator, as well as the 10th and 90th percentiles, each calculated for the entire period of measurement. Time series plots were only developed for datasets with at least 10 years of data. Two symbols located to the right of each plot describe how recent values of an indicator compare against the overall series. A black circle indicates whether the indicator values over the last five years are on average above the series 90th percentile (plus sign), below the 10th percentile (minus sign), or between those two values (solid circle). Beneath that an arrow reflects the trend of the indicator over the last five years; an increase or decrease greater than one standard deviation is reflected in upward or downward arrows respectively, while a change of less than one standard deviation is recorded by a left-right arrow.
Lake Erie SST
During the last five years there has been no notable trend and values were between the 10th and 90th percentile of all observed data in the time series.
Sea surface temperature is defined as the average temperature of the top few millimeters of the ocean. Sea surface temperature monitoring tells us how the ocean and atmosphere interact, as well as providing fundamental data on the global climate system.
Data Interpretation:
Time series: The time series shows the integrated sea surface temperature across Lake Erie. During the last five years there has been no notable trend and values were between the 10th and 90th percentile of all observed data in the time series.
Description of Sea Surface Temperature:
Sea surface temperature (SST) is defined as the temperature of the top few millimeters of the ocean. This temperature directly or indirectly impacts the rate of all physical, chemical, and most biological processes occurring in the ocean. SST is globally monitored by sensors on satellites, buoys, ships, ocean reference stations, autonomous underwater vehicles (AUVs) and other technologies.
SST monitoring tells us how the ocean and atmosphere interact, as well as providing fundamental data on the global climate system. This information also aids us in weather prediction, i.e. identifying the onset of El Niño and La Niña cycles - multiyear shifts in atmospheric pressure and wind speeds. These shifts affect ocean circulation, global weather patterns, and marine ecosystems. SST anomalies have been linked to shifting marine resources. With warming temperatures, we observe the poleward movements of fish and other species. Temperature extremes—both ocean heatwaves and cold spells—have been linked to coral bleaching as well as fishery and aquaculture mortality. We present the annual average SST in all regions.
Lake Erie Description
Lake Erie is the shallowest of the five Great Lakes with a maximum depth of 64 m or 210 ft. While only the fourth largest Great Lake with a water surface area of 25,655 square kilometers or 9,910 square miles. In the United States, about 10.5 million US residents live along Lake Erie and in Canada, roughly 1.9 million Canadians live near Lake Erie.
Data:
Great Lakes SST data were accessed from (https://coastwatch.glerl.noaa.gov/glsea/glsea.html).
The data are plotted in degrees Celsius.
Lake Erie Ice
During the last five years, there has been no notable trend and values are within the 10th and 90th percentiles.
Values correspond to annual maximum percentage of total lake surface area of lake ice cover
Data Interpretation:
This time series shows the sea ice extent for Lake Erie from 1979 to 2024. During the last five years, there has been no notable trend and values are within the 10th and 90th percentiles.
Indicator and source information:
The time series shows the lake ice extent for Lake Erie for each winter. The annual maximum extent as percentage of total lake surface area between December and May of each winter season in the Great Lakes region.
Data background and limitations:
Great Lakes ice data was accessed from the NOAA Great Lakes Environmental Research Laboratory, https://www.glerl.noaa.gov/data/ice. Original ice charts from 1973 through 1988 are from the Canadian Ice Service. Beginning in 1989, the source was the U.S. National Ice Center (USNIC). Currently, data from both Canadian and U.S. sources are combined in USNIC's daily products. The data are plotted as a percentage of total lake surface area.
Lake Erie Level
During the last five years, there has been a significant downward trend and values were above the 90th percentile of all observed data in the time series.
Sea level varies due to the force of gravity, the Earth’s rotation and irregular features on the ocean floor. Other forces affecting sea levels include temperature, wind, ocean currents, tides, and other similar processes.
Description of time series:
The time series shows the relative lake level for this region. During the last five years, there has been a significant downward trend and values were above the 90th percentile of all observed data in the time series.
Indicator and source information:
Water levels of the Great Lakes fluctuate dramatically in response to a variety of factors. The lakes have experienced record high levels in 2019 and 2020, less than a decade after an extended period of low water ending in 2013—showcasing the dramatic changes water levels can experience from year to year. Changing water levels can impact water dependent industries such as shipping, fisheries, tourism, and coastal infrastructure including coastal roads, piers, and wetlands.
Great Lakes water levels are continuously monitored by U.S. and Canadian federal agencies in the region through a binational partnership. Water level monitoring stations are operated by NOAA's Center for Operational Oceanographic Products and Services (CO-OPS) and the Department of Fisheries and Oceans' Canadian Hydrographic Service. The U.S. Army Corps of Engineers (Detroit, Chicago, Buffalo) and Environment and Climate Change Canada play crucial roles in research, coordination of data and operational seasonal water level forecasts for the basin
Data background and limitations:
Great Lakes data come from:https://www.glerl.noaa.gov/data/wlevels/#overview; and http://www.greatlakescc.org/wp36/
Lake Erie Heatwave Intensity
During the last five years there has been no trend and the five-year average is between the 10th and 90th percentiles of all observed data in the time series.
Values indicate cumulative annual heatwave intensity and duration in a region in degree-days
Description of Time Series: This time series shows the average integrated degree day value for the Lake Erie region. During the last five years there has been no trend and the five-year average is between the 10th and 90th percentiles of all observed data in the time series.
Indicator Source Information:
The marine heatwave data shown here are calculated by NOAA’s National Centers for Environmental Information using Optimum Interpolation Sea Surface Temperature (OISST) data. The NOAA 1/4° OISST is a long term Climate Data Record that incorporates observations from different platforms (satellites, ships, buoys and Argo floats) into a regular global grid. The dataset is interpolated to fill gaps on the grid and create a spatially complete map of sea surface temperature. Satellite and ship observations are referenced to buoys to compensate for platform differences and sensor biases.
Data Background and Caveats:
Heatwave metrics are calculated using OISST, a product that uses some forms of interpolation to fill data gaps. Heatwaves are defined by Hobday et al., 2016 as distinct events where SST anomaly reaches the 90th percentile in a pixel for at least 5 days, separated out by 3 or more days.
Lake Erie Heatwave Area
During the last five years there has been no trend and the five-year average is between the 10th and 90th percentiles of all observed data in the time series.
Values indicate monthly percent of an LME area affected by heatwave
Description of Time Series:
This time series shows the monthly heatwave spatial coverage for the Lake Erie Region. During the last five years there has been no trend and the five-year average is between the 10th and 90th percentiles of all observed data in the time series.
Indicator Source Information:
The marine heatwave data shown here are calculated by NOAA’s National Centers for Environmental Information using Optimum Interpolation Sea Surface Temperature (OISST) data. The NOAA 1/4° OISST is a long term Climate Data Record that incorporates observations from different platforms (satellites, ships, buoys and Argo floats) into a regular global grid. The dataset is interpolated to fill gaps on the grid and create a spatially complete map of sea surface temperature. Satellite and ship observations are referenced to buoys to compensate for platform differences and sensor biases.
Data Background and Caveats:
Heatwave metrics are calculated using OISST, a product that uses some forms of interpolation to fill data gaps. Heatwaves are defined by Hobday et al., 2016 as distinct events where SST anomaly reaches the 90th percentile in a pixel for at least 5 days, separated out by 3 or more days.
Lake Erie US Commercial Landings
Between 2010 and 2015, commercial landings from Lake Erie were around historic levels, and there is no recent trend apparent.
Values correspond to landings in millions of metric tons
Commercial Landings Time Series
Between 2010 and 2015, commercial landings from Lake Erie were around historic levels, and there is no recent trend apparent.
Extreme Gauge values:
A value of zero on the gauge means that the average revenue or landings over the last 5 years of data was below any annual value up until that point, while a value of 100 would indicate the average value over that same period was above any annual value up until that point.
Indicator Source Information:
Commercial fish catch data (called production) for the Great Lakes were published by the Great Lakes Fishery Commission in 1962 (Technical Report No.3) and covered the period 1867-1960. A supplement covering the years 1961-1968 was released in 1970, and a revised edition covering the years 1867-1977 was published in 1979. This third update of a web-based version covers the period 1867-2015
Lake Erie US Beach Closures
During the last five years, there has been no notable trend and values have remained within the 10th and 90th percentiles of all observed data in the time series.
Beach closures are the number of days when beach water quality is determined to be unsafe.
Data Interpretation:
Time series: This time series shows the average number of beach closure days in Lake Erie from 2000 to 2023. During the last five years, there has been no notable trend and values have remained within the 10th and 90th percentiles of all observed data in the time series.
Indicator and source information:
Unsafe water quality may have significant impacts on human health, local economies, and the ecosystem. Beach water quality is determined by the concentration of bacteria in the water (either Enterococcus sp. or Escherichia coli).
The US Environmental Protection Agency (EPA) supports coastal states, counties and tribes in monitoring beach water quality, and notifying the public when beaches must be closed. The information presented is from states, counties, and tribes that submit data to the EPA Beach Program reporting database (BEACON). Data obtained from the EPA BEACON 2.0 website have been provided to EPA by the coastal and Great Lakes states, tribes and territories that receive grants under the BEACH Act. Data were refined to closure, by state or territory, by year.
Data background and limitations:
Data compiled by states or territories are combined in regions defined as US Large Marine Ecosystems (LME). Changes in the number of beach closure days may be driven by changes in the number of beaches monitored under the BEACH Act versus by state and local municipalities and not by changes in water and/or air quality. Not all US beach closures are captured in this database, because not all beaches in a state or territory are monitored through the EPA BEACH Act. Data that were not identified to a water body or identified as inland water were not included. Data for beaches monitored by state and local municipalities are not included.
Data from 2020 may be inflated by the Covid-19 pandemic, as there was no consistent way for states to report pandemic-related closures
Close
Lake Erie US Coastal Population
The 2017 – 2022 average coastal population around Lake Erie was around historic levels, and the recent trend is not different from historical trends.
Values correspond to the total coastal population for a given region
Time Series
The 2017 – 2022 average coastal population around Lake Erie was around historic levels, and the recent trend is not different from historical trends.
Indicator Source Information:
The American Community Survey (ACS) helps local officials, community leaders, and businesses understand the changes taking place in their communities. It is the premier source for detailed population and housing information about our nation.
Data Background and Caveats:
The values represented here are coastal county population estimates for states bordering US Large Marine Ecosystems as calculated by the US Census Bureau from the American Community Survey.
Lake Erie Total US Coastal Employment
Average coastal employment around Lake Erie between 2017 and 2021 was similar to historical levels, and no trend is apparent over that same period.
Values correspond to total employment in all industries in the coastal counties of a given region
Time Series
Average coastal employment around Lake Erie between 2017 and 2021 was similar to historical levels, and no trend is apparent over that same period.
Data Source:
Coastal employment numbers were downloaded from the NOAA ENOW Explorer Tool, filtered to present only coastal county values using the Census Bureau’s list of coastal counties within each state. ENOW Explorer streamlines the task of obtaining and comparing economic data, both county and state, for the six sectors dependent on the ocean and Great Lakes: living resources, marine construction, marine transportation, offshore mineral resources, ship and boat building, and tourism and recreation. Data are derived from Economics: National Ocean Watch (ENOW), available on NOAA’s Digital Coast. Of note is that these data fail to include self-employed individuals. Coastal county employment numbers were then summed within each region for reporting purposes.
Lake Erie Coastal Tourism GDP
Between 2016 and 2021 the average change in coastal county tourism GDP showed no trend.
Values correspond to percent change in the GDP of the Tourism Sector of Coastal Counties in US States that border a region
Description of Time Series:
Between 2016 and 2021 the average change in coastal county tourism GDP showed no trend.
Indicator Source Information
Coastal tourism Gross Domestic Product is the total measure (in billions of 2012 dollars) of goods and services provided from various industries involved in tourism services and products along the coast. Data for Coastal Counties come from the US Census Bureau. This dataset represents US counties and independent cities which have at least one coastal border and select non-coastal counties and independent cities based on proximity to estuaries and other coastal counties. The dataset is built to support coastal and ocean planning and other activities pursuant to the Energy Policy Act, Coastal Zone Management Act, Magnuson-Stevens Fishery Conservation and Management Act, National Environmental Policy Act, Rivers and Harbors Act and the Submerged Lands Act.
Lake Erie Tourism Wage
Between 2016 and 2021 the average total coastal county real wage compensation showed a decreasing trend.
Values correspond to millions of dollars of total real wage compensation of the Tourism Sector of Coastal Counties in US States that border a region
Description of Time Series: Between 2016 and 2021 the average total coastal county real wage compensation showed a decreasing trend.
Indicator Source Information:
Coastal tourism wage is the measure of wages (nominal) paid to employees in tourism industries along the coast. Data for Coastal Counties come from the US Census Bureau. This dataset represents US counties and independent cities which have at least one coastal border and select non-coastal counties and independent cities based on proximity to estuaries and other coastal counties. The dataset is built to support coastal and ocean planning and other activities pursuant to the Energy Policy Act, Coastal Zone Management Act, Magnuson-Stevens Fishery Conservation and Management Act, National Environmental Policy Act, Rivers and Harbors Act and the Submerged Lands Act.
Lake Erie Coastal Tourism Employment
Between 2016 and 2021 the average change in coastal county employment showed no trend but was lower than historical norms.
Values correspond to percent change in the total Employment of the Tourism Sector of Coastal Counties in US States that border a region
Description of Time Series: Between 2016 and 2021 the average change in coastal county employment showed no trend but was lower than historical norms.
Indicator Source Information:
Coastal tourism employment is the total measure of jobs in tourism industries along the coast. Data for Coastal Counties come from the US Census Bureau. This dataset represents US counties and independent cities which have at least one coastal border and select non-coastal counties and independent cities based on proximity to estuaries and other coastal counties. The dataset is built to support coastal and ocean planning and other activities pursuant to the Energy Policy Act, Coastal Zone Management Act, Magnuson-Stevens Fishery Conservation and Management Act, National Environmental Policy Act, Rivers and Harbors Act and the Submerged Lands Act.

State of the Great Lakes - Lake Erie
Based on the assessments of the nine State of the Great Lakes indicators, the overall status of the Lake Erie basin ecosystem is Poor and the trend is Unchanging.