
Description of Upwelling Indicator:
Upwelling is an important component of the California Current Ecosystem. Upwelling drives the biological productivity of the system by bringing nutrients to surface waters. The Biologically Effective Upwelling Transport Index (BEUTI; pronounced "beauty") estimates vertical transport of nitrate into the surface mixed layer; it is calculated as the product of upwelling strength and the concentration of nitrate in upwelled waters. BEUTI leverages state-of-the-art ocean models as well as satellite and in situ data to improve upon historically available upwelling indices for the U.S. west coast.
Indicator data and source information:
Values of BEUTI are provided by NMFS/SWFSC; detailed information about these indices can be found here. Values represent March-July Means for each year.
For the most up to date data, please reference the original source above.
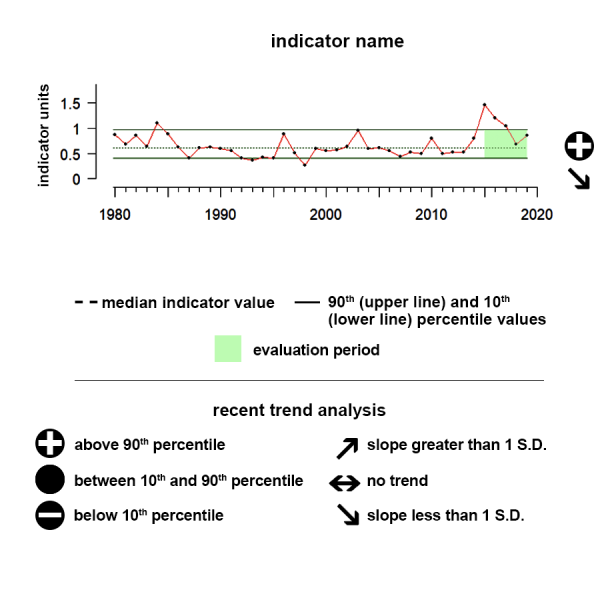
Understanding the Time series plots
Time series plots show the changes in each indicator as a function of time, over the period 1980-present. Each plot also shows horizontal lines that indicate the median (middle) value of that indicator, as well as the 10th and 90th percentiles, each calculated for the entire period of measurement. Time series plots were only developed for datasets with at least 10 years of data. Two symbols located to the right of each plot describe how recent values of an indicator compare against the overall series. A black circle indicates whether the indicator values over the last five years are on average above the series 90th percentile (plus sign), below the 10th percentile (minus sign), or between those two values (solid circle). Beneath that an arrow reflects the trend of the indicator over the last five years; an increase or decrease greater than one standard deviation is reflected in upward or downward arrows respectively, while a change of less than one standard deviation is recorded by a left-right arrow.
California Current 31N to 34N Upwelling
Between 2019 and 2024 BEUTI showed no trend and the average of the last 5 years remains between the 10th and 90th percentiles.
Values indicate the vertical transport of nitrate averaged from 31 to 34 degrees north (southern California Bight) from March-July of each year.
Description of time series:
Between 2019 and 2024 BEUTI showed no trend and the average of the last 5 years remains between the 10th and 90th percentiles.
Indicator data and source information:
Values of BEUTI are provided by NMFS/SWFSC; detailed information about these indices can be found at https://oceanview.pfeg.noaa.gov/products/upwelling/cutibeuti. Values represent March-July Means for each year.
Data source:
https://oceanview.pfeg.noaa.gov/products/upwelling/cutibeuti
California Current 35N to 40N Upwelling
Between 2019 and 2024 BEUTI showed no trend and the average of the last 5 years remains between the 10th and 90th percentiles.
Values indicate the vertical transport of nitrate averaged from 35 to 40 degrees north (central/northern California).
Description of time series:
Between 2019 and 2024 BEUTI showed no trend and the average of the last 5 years remains between the 10th and 90th percentiles.
Indicator data and source information:
Values of BEUTI are provided by NMFS/SWFSC; detailed information about these indices can be found at https://oceanview.pfeg.noaa.gov/products/upwelling/cutibeuti Values represent March-July Means for each year.
Data source:
https://oceanview.pfeg.noaa.gov/products/upwelling/cutibeuti
California Current Upwelling 41N to 47N
Between 2019 and 2024 BEUTI showed a significant downward trend and the average of the last 5 years remains between the 10th and 90th percentiles.
Values indicate the vertical transport of nitrate averaged from 41 to 47 degrees north (northern California/Oregon/Washington).
Description of time series:
Between 2019 and 2024 BEUTI showed a significant downward trend and the average of the last 5 years remains between the 10th and 90th percentiles.
Indicator data and source information:
Values of BEUTI are provided by NMFS/SWFSC; detailed information about these indices can be found at https://oceanview.pfeg.noaa.gov/products/upwelling/cutibeuti. Values represent March-July Means for each year.
Data source:
https://oceanview.pfeg.noaa.gov/products/upwelling/cutibeuti

Additional Resources
Upwelling Indices
The Coastal Upwelling Transport Index (CUTI, pronounced “cutie”) and the Biologically Effective Upwelling Transport Index (BEUTI; pronounced “beauty”) are two new upwelling indices that leverage state-of-the-art ocean models as well as satellite and in situ data to improve upon historically available upwelling indices for the U.S. west coast.

NCEI Northeast Pacific Regional Climatology
These decadal climatologies were generated from regional data in the World Ocean Database (WOD) collected from 1955 to 2012. The description of datasets used can be found in WOD 2013.
