Description of Marine Species Distribution (Latitude and Depth):
The geographic location where a species is found, known as that species’ “distribution”, is a fundamental piece of information. Some species naturally move from location to location throughout the year, following seasons, food, or other factors. However, as climate change causes ocean waters to warm, populations of many species are moving towards the poles (northward in the northern hemisphere) or deeper towards cooler waters, allowing them to track their preferred temperature. In other cases, poleward shifts may be indicative of lower survival rates for species in warming areas. Understanding where and how fast marine species are moving is important to coastal communities as these changing distributions can affect the species available for fishing, recreation, and cultural practices. Marine species distributions are also good indicators of a warming ocean as they largely follow the species’ preferred temperature, can react quickly to ocean changes, and have been measured for many years, allowing us to see changes over time. 0 values correspond to the first year of available data for each metric.
Data Source:
The marine species distribution data shown here is the average “centroid”, or mean location (as either latitude or depth) of the species weighted by biomass, of a large number of species from a region. These centroids are calculated by NOAA’s DisMAP Program using data gathered by NOAA’s National Marine Fisheries Service (NMFS), and other agencies. NMFS monitors marine species populations by conducting annual bottom trawl surveys, some of which have been conducted for over 40 years.
For the most up to date data, please reference the original source above
Understanding the Time series plots
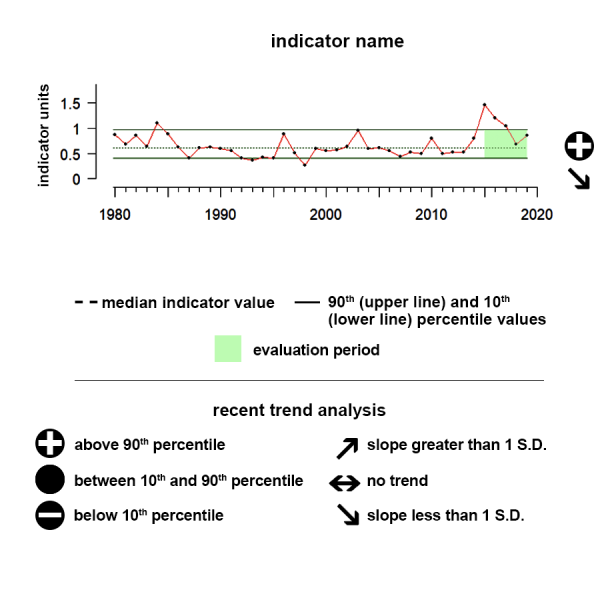
Time series plots show the changes in each indicator as a function of time, over the period 1980-present. Each plot also shows horizontal lines that indicate the median (middle) value of that indicator, as well as the 10th and 90th percentiles, each calculated for the entire period of measurement. Time series plots were only developed for datasets with at least 10 years of data. Two symbols located to the right of each plot describe how recent values of an indicator compare against the overall series. A black circle indicates whether the indicator values over the last five years are on average above the series 90th percentile (plus sign), below the 10th percentile (minus sign), or between those two values (solid circle). Beneath that an arrow reflects the trend of the indicator over the last five years; an increase or decrease greater than one standard deviation is reflected in upward or downward arrows respectively, while a change of less than one standard deviation is recorded by a left-right arrow.
Marine Species Distribution changes in Latitude
Eastern Bering Sea Marine Species Latitude
Between 2018 and 2023 the average species latitudinal shift showed no trend but was above historical ranges, indicating a northward shift in distributions.
Values indicate annual cumulative change in centroid across all species in a region in degrees N
Time Series: Between 2018 and 2023 the average species latitudinal shift showed no trend but was above historical ranges, indicating a northward shift in distributions.
Indicator Source Information:
This data was obtained from the Distribution Mapping and Analysis Portal (DisMAP). provides important information for fisheries management including which species are caught where and at what depth.The latitudinal (or depth) centroid is the biomass-weighted center of a population’s distribution. This metric is calculated by the DisMAP portal team using the interpolated biomass distribution surface they generated from the survey catch data, such that the latitudinal (or depth) centroids are the mean latitude (or depth) of the species distribution, where each raster cell latitude (or depth) is weighted by the value of weight-per-unit-effort for that cell. Scientists at NOAA use this data to calculate each species’ centroid as the mean latitude and depth of catch in the survey, weighted by biomass. The centroid for each species is calculated for each year after standardizing the data to ensure that the measure is consistent over time despite changes in survey techniques and total area surveyed. This data provides important information for fisheries management including which species are caught where and at what depth.
Data Background and Caveats:
The regional and national marine species distributions shown here represent the average shift in the centroid of a selected core set of species that are caught every year in surveys conducted in each region. These species represent a wide range of habitats and species types. As species distributions respond to many environmental and biological factors, combining data from multiple diverse species allows for a more complete picture of the general trends in marine species distribution. In order to more easily track and display changes in these distributions, the first year is standardized to zero. Thus, the indicator represents relative change in distribution from the first survey year.
Close
Gulf of Alaska Marine Species Latitude
Status and trend analyses are not appropriate for these data.
Values indicate annual cumulative change in centroid across all species in a region in degrees N
Description of Time Series: Status and trend analyses are not appropriate for these data.
Indicator Source Information:
This data was obtained from the Distribution Mapping and Analysis Portal (DisMAP). provides important information for fisheries management including which species are caught where and at what depth.The latitudinal (or depth) centroid is the biomass-weighted center of a population’s distribution. This metric is calculated by the DisMAP portal team using the interpolated biomass distribution surface they generated from the survey catch data, such that the latitudinal (or depth) centroids are the mean latitude (or depth) of the species distribution, where each raster cell latitude (or depth) is weighted by the value of weight-per-unit-effort for that cell. Scientists at NOAA use this data to calculate each species’ centroid as the mean latitude and depth of catch in the survey, weighted by biomass. The centroid for each species is calculated for each year after standardizing the data to ensure that the measure is consistent over time despite changes in survey techniques and total area surveyed. This data provides important information for fisheries management including which species are caught where and at what depth.
Data Background and Caveats:
The regional and national marine species distributions shown here represent the average shift in the centroid of a selected core set of species that are caught every year in surveys conducted in each region. These species represent a wide range of habitats and species types. As species distributions respond to many environmental and biological factors, combining data from multiple diverse species allows for a more complete picture of the general trends in marine species distribution. In order to more easily track and display changes in these distributions, the first year is standardized to zero. Thus, the indicator represents relative change in distribution from the first survey year.
Close
Gulf of America Marine Species Latitude
Between 2016 and 2021 the average species latitudinal shift shows a decreasing trend, indicating a southward shift in distributions.
Values indicate annual cumulative change in centroid across all species in a region in degrees N
Description of Time Series: Between 2016 and 2021 the average species latitudinal shift shows a decreasing trend, indicating a southward shift in distributions.
Indicator Source Information:
This data was obtained from the Distribution Mapping and Analysis Portal (DisMAP). provides important information for fisheries management including which species are caught where and at what depth. The latitudinal (or depth) centroid is the biomass-weighted center of a population’s distribution. This metric is calculated by the DisMAP portal team using the interpolated biomass distribution surface they generated from the survey catch data, such that the latitudinal (or depth) centroids are the mean latitude (or depth) of the species distribution, where each raster cell latitude (or depth) is weighted by the value of weight-per-unit-effort for that cell. Scientists at NOAA use this data to calculate each species’ centroid as the mean latitude and depth of catch in the survey, weighted by biomass. The centroid for each species is calculated for each year after standardizing the data to ensure that the measure is consistent over time despite changes in survey techniques and total area surveyed. This data provides important information for fisheries management including which species are caught where and at what depth.
Data Background and Caveats:
The regional and national marine species distributions shown here represent the average shift in the centroid of a selected core set of species that are caught every year in surveys conducted in each region. These species represent a wide range of habitats and species types. As species distributions respond to many environmental and biological factors, combining data from multiple diverse species allows for a more complete picture of the general trends in marine species distribution. In order to more easily track and display changes in these distributions, the first year is standardized to zero. Thus, the indicator represents relative change in distribution from the first survey year.
Northeast Marine Species Latitude
Between 2018 and 2023 the average species latitudinal shift showed no trend but is above historical averages.
Values indicate annual cumulative change in centroid across all species in a region in degrees N
Description of Time Series: Between 2018 and 2023 the average species latitudinal shift showed no trend but is above historical averages.
Indicator Source Information:
This data was obtained from the Distribution Mapping and Analysis Portal (DisMAP). provides important information for fisheries management including which species are caught where and at what depth. The latitudinal (or depth) centroid is the biomass-weighted center of a population’s distribution. This metric is calculated by the DisMAP portal team using the interpolated biomass distribution surface they generated from the survey catch data, such that the latitudinal (or depth) centroids are the mean latitude (or depth) of the species distribution, where each raster cell latitude (or depth) is weighted by the value of weight-per-unit-effort for that cell. Scientists at NOAA use this data to calculate each species’ centroid as the mean latitude and depth of catch in the survey, weighted by biomass. The centroid for each species is calculated for each year after standardizing the data to ensure that the measure is consistent over time despite changes in survey techniques and total area surveyed. This data provides important information for fisheries management including which species are caught where and at what depth.
Data Background and Caveats:
The regional and national marine species distributions shown here represent the average shift in the centroid of a selected core set of species that are caught every year in surveys conducted in each region. These species represent a wide range of habitats and species types. As species distributions respond to many environmental and biological factors, combining data from multiple diverse species allows for a more complete picture of the general trends in marine species distribution. In order to more easily track and display changes in these distributions, the first year is standardized to zero. Thus, the indicator represents relative change in distribution from the first survey year.
Southeast Marine Species Latitude
Between 2016 and 2022 the average species latitudinal shift showed no trend.
Values indicate annual cumulative change in centroid across all species in a region in degrees N
Description of Time Series: Between 2016 and 2022 the average species latitudinal shift showed no trend.
Indicator Source Information:
This data was obtained from the Distribution Mapping and Analysis Portal (DisMAP). provides important information for fisheries management including which species are caught where and at what depth.The latitudinal (or depth) centroid is the biomass-weighted center of a population’s distribution. This metric is calculated by the DisMAP portal team using the interpolated biomass distribution surface they generated from the survey catch data, such that the latitudinal (or depth) centroids are the mean latitude (or depth) of the species distribution, where each raster cell latitude (or depth) is weighted by the value of weight-per-unit-effort for that cell. Scientists at NOAA use this data to calculate each species’ centroid as the mean latitude and depth of catch in the survey, weighted by biomass. The centroid for each species is calculated for each year after standardizing the data to ensure that the measure is consistent over time despite changes in survey techniques and total area surveyed. This data provides important information for fisheries management including which species are caught where and at what depth.
Data Background and Caveats:
The regional and national marine species distributions shown here represent the average shift in the centroid of a selected core set of species that are caught every year in surveys conducted in each region. These species represent a wide range of habitats and species types. As species distributions respond to many environmental and biological factors, combining data from multiple diverse species allows for a more complete picture of the general trends in marine species distribution. In order to more easily track and display changes in these distributions, the first year is standardized to zero. Thus, the indicator represents relative change in distribution from the first survey year.
Close
California Current Marine Species Latitude
Between 2018 and 2023 the average species latitudinal shift showed no trend.
Values indicate annual cumulative change in centroid across all species in a region in degrees N
Description of Time Series: Between 2018 and 2023 the average species latitudinal shift showed no trend.
Indicator Source Information:
This data was obtained from the Distribution Mapping and Analysis Portal (DisMAP). provides important information for fisheries management including which species are caught where and at what depth.The latitudinal (or depth) centroid is the biomass-weighted center of a population’s distribution. This metric is calculated by the DisMAP portal team using the interpolated biomass distribution surface they generated from the survey catch data, such that the latitudinal (or depth) centroids are the mean latitude (or depth) of the species distribution, where each raster cell latitude (or depth) is weighted by the value of weight-per-unit-effort for that cell. Scientists at NOAA use this data to calculate each species’ centroid as the mean latitude and depth of catch in the survey, weighted by biomass. The centroid for each species is calculated for each year after standardizing the data to ensure that the measure is consistent over time despite changes in survey techniques and total area surveyed. This data provides important information for fisheries management including which species are caught where and at what depth.
Data Background and Caveats:
The regional and national marine species distributions shown here represent the average shift in the centroid of a selected core set of species that are caught every year in surveys conducted in each region. These species represent a wide range of habitats and species types. As species distributions respond to many environmental and biological factors, combining data from multiple diverse species allows for a more complete picture of the general trends in marine species distribution. In order to more easily track and display changes in these distributions, the first year is standardized to zero. Thus, the indicator represents relative change in distribution from the first survey year.
Close
Marine Species Distribution Changes in Water Column Depth
Eastern Bering Sea Marine Species Depth
Between 2018 and 2023 the average species water column depth shift showed a significant downward trend, indicating the distribution moved deeper.
Values Indicate annual cumulative change in average species centroid depth in meters - for example, a value of -5 indicates the species centroid moving deeper by 5m.
Description of Time Series: Between 2018 and 2023 the average species water column depth shift showed a significant downward trend, indicating the distribution moved deeper.
Indicator Source Information:
This data was obtained from the Distribution Mapping and Analysis Portal (DisMAP). The latitudinal (or depth) centroid is the biomass-weighted center of a population’s distribution. This metric is calculated by the DisMAP portal team using the interpolated biomass distribution surface they generated from the survey catch data, such that the latitudinal (or depth) centroids are the mean latitude (or depth) of the species distribution, where each raster cell latitude (or depth) is weighted by the value of weight-per-unit-effort for that cell. The centroid for each species is calculated for each year after standardizing the data to ensure that the measure is consistent over time despite changes in survey techniques and total area surveyed. This data provides important information for fisheries management including which species are caught where and at what depth.
Data Background and Caveats:
The regional and national marine species distributions shown here represent the average centroid of a selected core set of species that are caught every year of the surveys in a region. These species represent a wide range of habitats and species types. As species distributions respond to many environmental and biological factors, combining data from multiple diverse species allows for a more complete picture of the general trends in marine species distribution. In order to more easily track and display changes in these distributions, the first year is standardized to zero. Thus, the indicator represents relative change in distribution from the first survey year.
Gulf of Alaska Marine Species Depth
Status and trend analyses are not appropriate for these data.
Values Indicate annual cumulative change in average species centroid depth in meters - for example, a value of -5 indicates the species centroid moving deeper by 5m.
Description of Time Series: Status and trend analyses are not appropriate for these data.
Indicator Source Information:
This data was obtained from the Distribution Mapping and Analysis Portal (DisMAP). The latitudinal (or depth) centroid is the biomass-weighted center of a population’s distribution. This metric is calculated by the DisMAP portal team using the interpolated biomass distribution surface they generated from the survey catch data, such that the latitudinal (or depth) centroids are the mean latitude (or depth) of the species distribution, where each raster cell latitude (or depth) is weighted by the value of weight-per-unit-effort for that cell. The centroid for each species is calculated for each year after standardizing the data to ensure that the measure is consistent over time despite changes in survey techniques and total area surveyed. This data provides important information for fisheries management including which species are caught where and at what depth.
Data Background and Caveats:
The regional and national marine species distributions shown here represent the average centroid of a selected core set of species that are caught every year of the surveys in a region. These species represent a wide range of habitats and species types. As species distributions respond to many environmental and biological factors, combining data from multiple diverse species allows for a more complete picture of the general trends in marine species distribution. In order to more easily track and display changes in these distributions, the first year is standardized to zero. Thus, the indicator represents relative change in distribution from the first survey year.
Close
Gulf of America Marine Species Depth
Between 2016 and 2021 the average species water column depth shift shows a significant downward trend, indicating the distribution moved deeper.
Values Indicate annual cumulative change in average species centroid depth in meters - for example, a value of -5 indicates the species centroid moving deeper by 5m.
Description of Time Series: Between 2016 and 2021 the average species water column depth shift shows a significant downward trend, indicating the distribution moved deeper.
Indicator Source Information:
This data was obtained from the Distribution Mapping and Analysis Portal (DisMAP). The latitudinal (or depth) centroid is the biomass-weighted center of a population’s distribution. This metric is calculated by the DisMAP portal team using the interpolated biomass distribution surface they generated from the survey catch data, such that the latitudinal (or depth) centroids are the mean latitude (or depth) of the species distribution, where each raster cell latitude (or depth) is weighted by the value of weight-per-unit-effort for that cell. The centroid for each species is calculated for each year after standardizing the data to ensure that the measure is consistent over time despite changes in survey techniques and total area surveyed. This data provides important information for fisheries management including which species are caught where and at what depth.
Data Background and Caveats:
The regional and national marine species distributions shown here represent the average centroid of a selected core set of species that are caught every year of the surveys in a region. These species represent a wide range of habitats and species types. As species distributions respond to many environmental and biological factors, combining data from multiple diverse species allows for a more complete picture of the general trends in marine species distribution. In order to more easily track and display changes in these distributions, the first year is standardized to zero. Thus, the indicator represents relative change in distribution from the first survey year.
Close
Northeast Marine Species Depth
Between 2018 and 2023 the average species water column depth shift shows no significant trend, though values are below historic norms.
Values Indicate annual cumulative change in average species centroid depth in meters - for example, a value of -5 indicates the species centroid moving deeper by 5m.
Description of Time Series: Between 2018 and 2023 the average species water column depth shift shows no significant trend, though values are below historic norms.
Indicator Source Information:
This data was obtained from the Distribution Mapping and Analysis Portal (DisMAP). The latitudinal (or depth) centroid is the biomass-weighted center of a population’s distribution. This metric is calculated by the DisMAP portal team using the interpolated biomass distribution surface they generated from the survey catch data, such that the latitudinal (or depth) centroids are the mean latitude (or depth) of the species distribution, where each raster cell latitude (or depth) is weighted by the value of weight-per-unit-effort for that cell. The centroid for each species is calculated for each year after standardizing the data to ensure that the measure is consistent over time despite changes in survey techniques and total area surveyed. This data provides important information for fisheries management including which species are caught where and at what depth.
Data Background and Caveats:
The regional and national marine species distributions shown here represent the average centroid of a selected core set of species that are caught every year of the surveys in a region. These species represent a wide range of habitats and species types. As species distributions respond to many environmental and biological factors, combining data from multiple diverse species allows for a more complete picture of the general trends in marine species distribution. In order to more easily track and display changes in these distributions, the first year is standardized to zero. Thus, the indicator represents relative change in distribution from the first survey year.
Close
Southeast Marine Species Depth
Between 2016 and 2022 the average species water column depth shift showed no trend.
Values Indicate annual cumulative change in average species centroid depth in meters - for example, a value of -5 indicates the species centroid moving deeper by 5m.
Description of Time Series: Between 2016 and 2022 the average species water column depth shift showed no trend.
Indicator Source Information:
This data was obtained from the Distribution Mapping and Analysis Portal (DisMAP). The latitudinal (or depth) centroid is the biomass-weighted center of a population’s distribution. This metric is calculated by the DisMAP portal team using the interpolated biomass distribution surface they generated from the survey catch data, such that the latitudinal (or depth) centroids are the mean latitude (or depth) of the species distribution, where each raster cell latitude (or depth) is weighted by the value of weight-per-unit-effort for that cell. The centroid for each species is calculated for each year after standardizing the data to ensure that the measure is consistent over time despite changes in survey techniques and total area surveyed. This data provides important information for fisheries management including which species are caught where and at what depth.
Data Background and Caveats:
The regional and national marine species distributions shown here represent the average centroid of a selected core set of species that are caught every year of the surveys in a region. These species represent a wide range of habitats and species types. As species distributions respond to many environmental and biological factors, combining data from multiple diverse species allows for a more complete picture of the general trends in marine species distribution. In order to more easily track and display changes in these distributions, the first year is standardized to zero. Thus, the indicator represents relative change in distribution from the first survey year.
California Current Marine Species Depth
Between 2018 and 2023 the average species water column depth shift shows a significant downward trend, indicating the distribution moved deeper.
Values Indicate annual cumulative change in average species centroid depth in meters - for example, a value of -5 indicates the species centroid moving deeper by 5m.
Description of Time Series: Between 2018 and 2023 the average species water column depth shift shows a significant downward trend, indicating the distribution moved deeper.
Indicator Source Information:
This data was obtained from the Distribution Mapping and Analysis Portal (DisMAP). The latitudinal (or depth) centroid is the biomass-weighted center of a population’s distribution. This metric is calculated by the DisMAP portal team using the interpolated biomass distribution surface they generated from the survey catch data, such that the latitudinal (or depth) centroids are the mean latitude (or depth) of the species distribution, where each raster cell latitude (or depth) is weighted by the value of weight-per-unit-effort for that cell. The centroid for each species is calculated for each year after standardizing the data to ensure that the measure is consistent over time despite changes in survey techniques and total area surveyed. This data provides important information for fisheries management including which species are caught where and at what depth.
Data Background and Caveats:
The regional and national marine species distributions shown here represent the average centroid of a selected core set of species that are caught every year of the surveys in a region. These species represent a wide range of habitats and species types. As species distributions respond to many environmental and biological factors, combining data from multiple diverse species allows for a more complete picture of the general trends in marine species distribution. In order to more easily track and display changes in these distributions, the first year is standardized to zero. Thus, the indicator represents relative change in distribution from the first survey year.
Close

Resources
NOAA Distribution Mapping and Analysis Portal
Given the potential impacts of shifting distributions on sustainable fisheries management, and the cross-jurisdictional nature of the issue, it is crucial that scientists and managers have access to information on historic and projected stock distributions for use in decision-making. NOAA collects extensive information on the distribution of species through surveys, and is increasingly conducting research into the distributions of fish stocks, however access to this information is not consistent across the regions.
The Distribution Mapping and Analysis Portal (DisMAP) consolidates data on species distributions into one user-friendly and interactive website. It provides tools for exploring changes in marine fish and invertebrate distributions through time. Our mission is to:
- Improve ease of access to and exploration of species distribution data
- Support decision-makers to use this spatial data for insight and informing decisions, such as fishing closed areas, marine protected areas, allocations, stock boundaries, survey designs
- Foster sharing and exchange of practices and ideas among scientists working on species distribution modeling.
This effort grew out of and builds off of the OceanAdapt website, a successful collaboration between the Rutgers University (Pinsky Lab), NOAA Fisheries and Fisheries and Oceans Canada. The DisMAP will continue to provide information previously provided by OceanAdapt, and expand to incorporate additional data types, model outputs and functionality over time.

Ocean ADAPT
OceanAdapt is a collaboration between Rutgers University, the National Marine Fisheries Service (NMFS), and Fisheries and Oceans Canada (DFO) to provide information about the impacts of changing climate and other factors on the distribution of marine life to the National Climate Assessment, fisheries communities, policymakers, and to others. This website hosts an annually updated database of scientific surveys in the United States and Canada, providing tools for exploring changes in marine fish and invertebrate distributions.