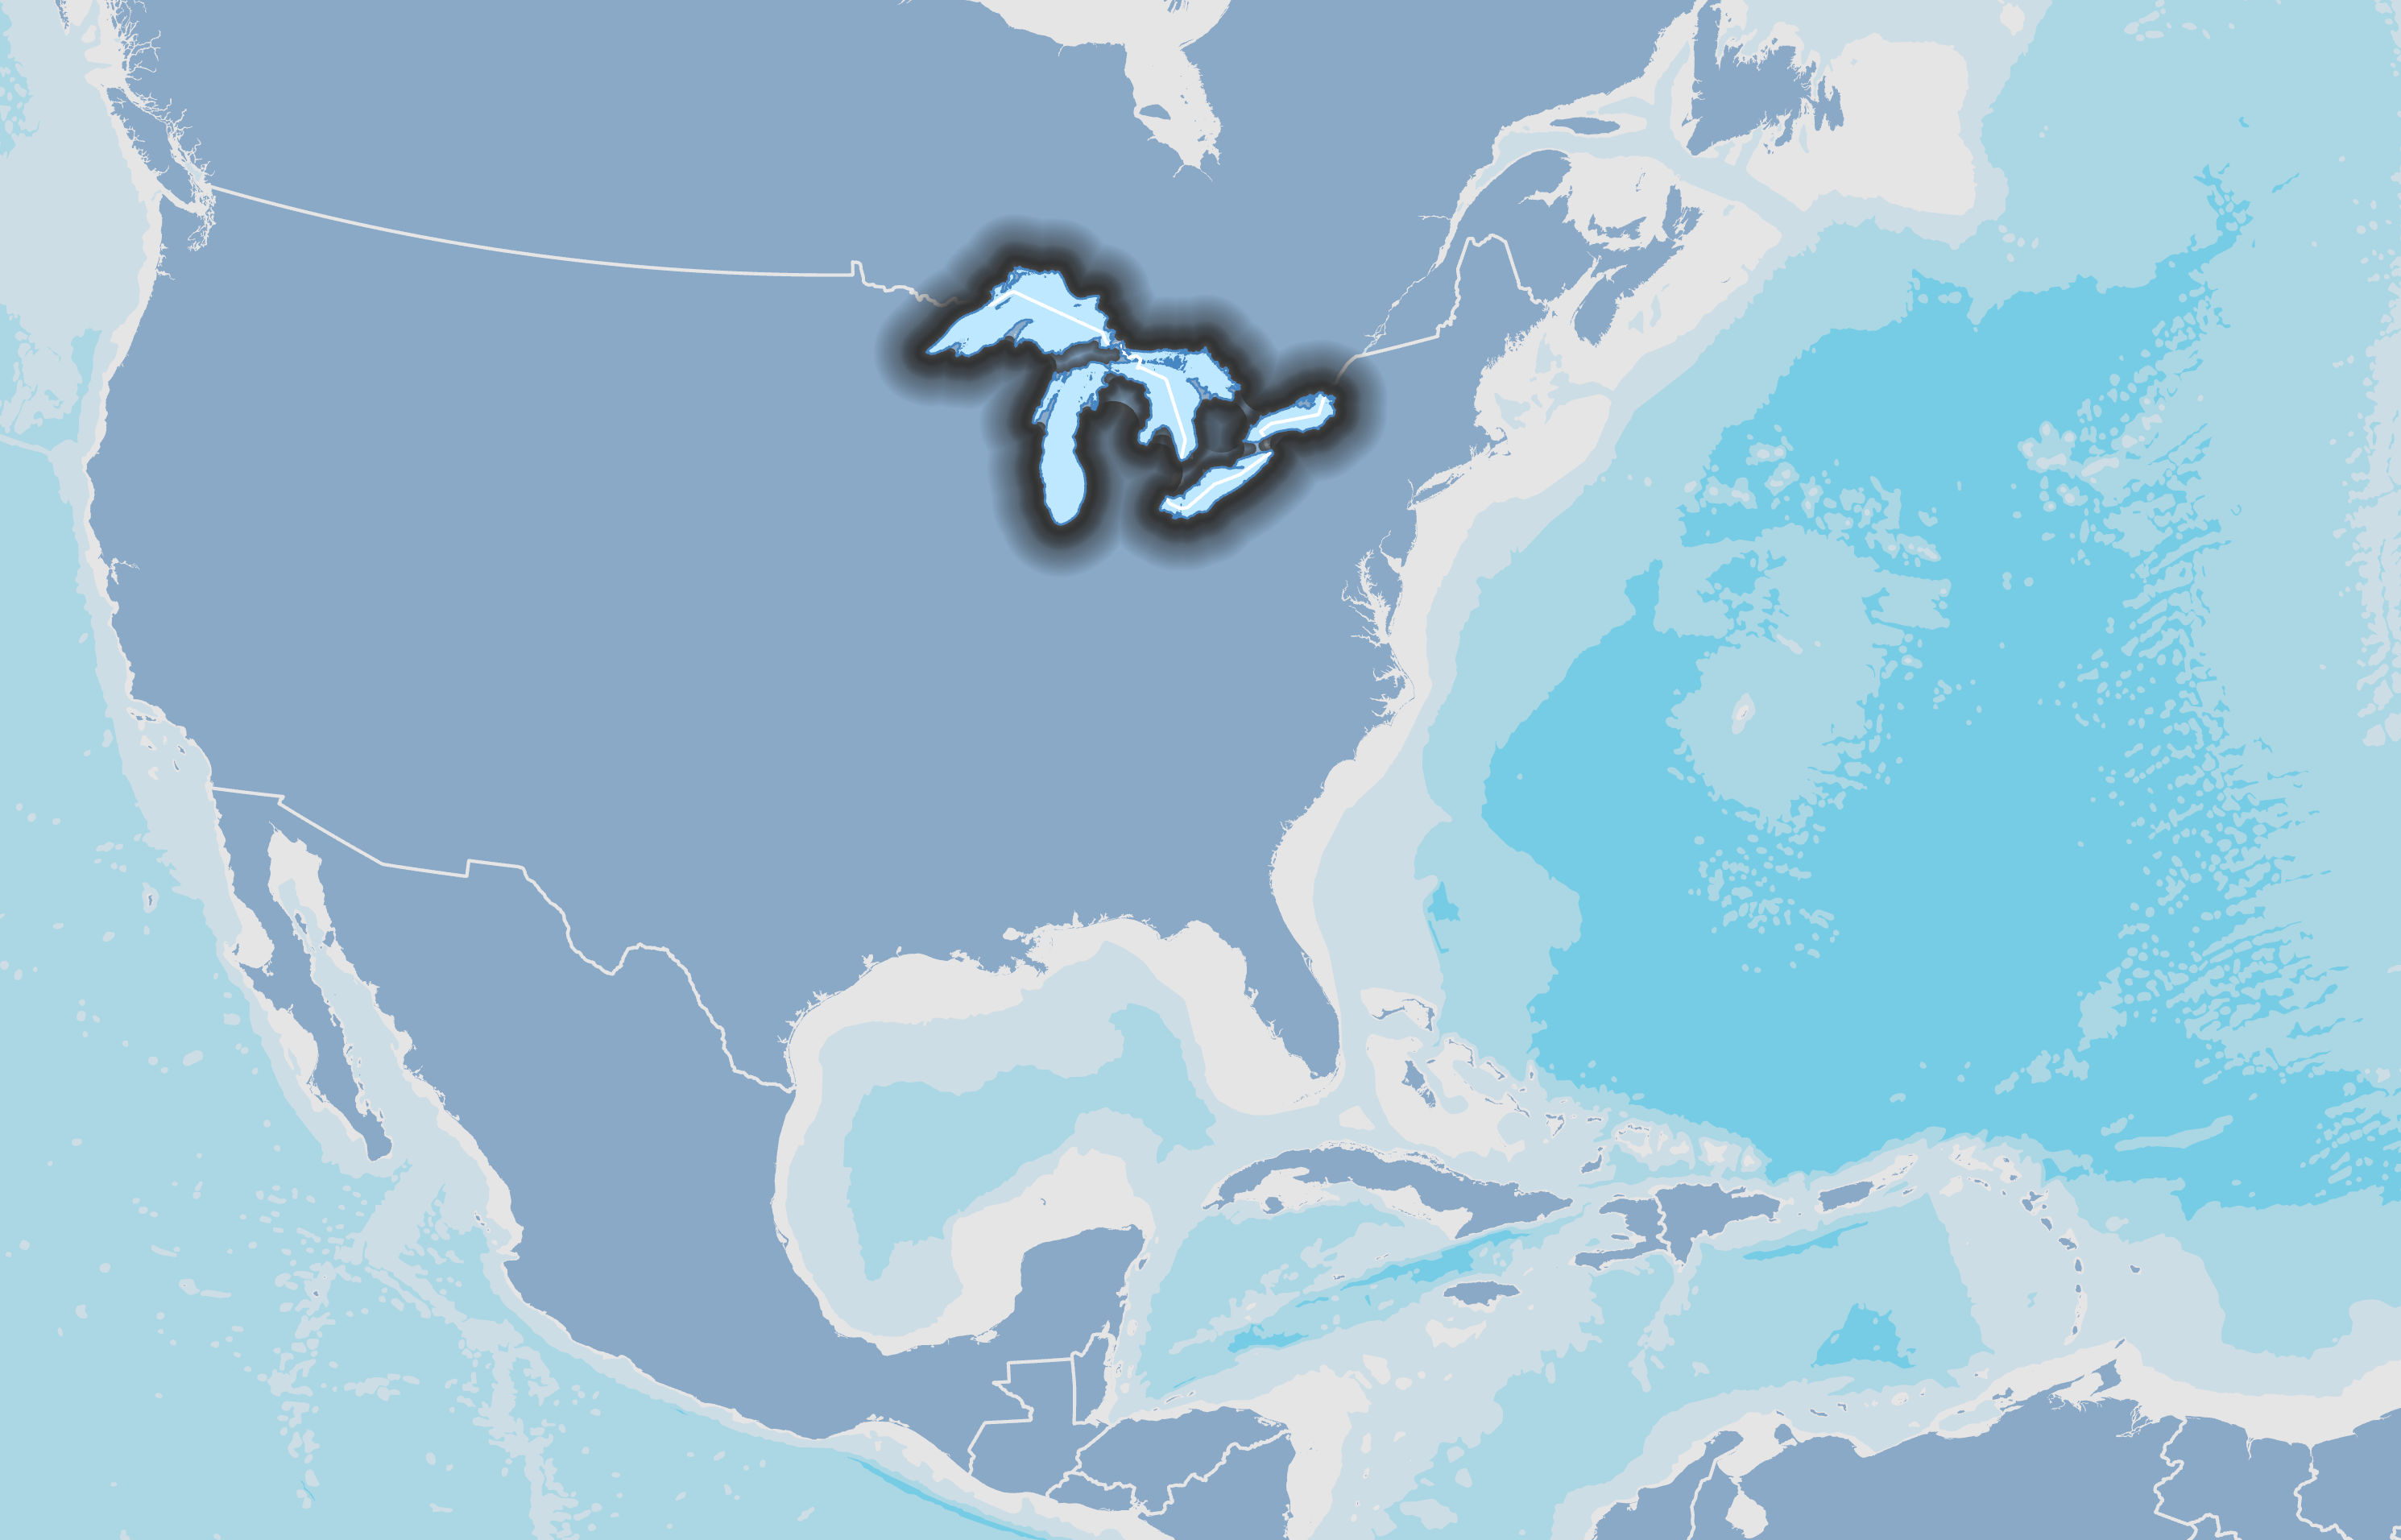
The Great Lakes are a dominant physical feature of North America and form part of the political boundary between the United States and Canada. The system includes five Great Lakes (Superior, Huron, Michigan, Erie and Ontario), Lake St. Clair and the connecting channels, along with many harbors and bays. Each lake has distinctive basin features, circulation and ecology. The Great Lakes are socially, economically, and environmentally significant to the region, the nation and the planet.
The Lakes’ moderating effects on climate influence the human culture, activities, agriculture and health of adjacent coastal areas. Waterborne commerce moves millions of tons of cargo annually through the Great Lakes. Shipping is an economically efficient method of transporting raw materials, finished goods and agricultural products. However, shipping is also a vector for non-native species, several of which may be detrimental to the Great Lakes ecosystem. The economy is diverse in the Great Lakes, with major sectors in industry, recreation and tourism, agriculture, commercial and sport fisheries, forestry, and mining.
The Region contains nearly 20 percent of the world’s fresh surface water and have over 9,000 miles of coastline. Most of North America’s fresh surface water (95%) is in the Great Lakes. The Great Lakes, their respective watersheds and waterways, and the ocean are all connected. Within the Great Lakes system, water flows from Lake Superior and Lake Michigan to Lake Huron, through Lake St. Clair into Lake Erie, over Niagara Falls and into Lake Ontario before flowing through the St. Lawrence River into the ocean.
Life in the Great Lakes ranges in size from the smallest blue-green bacteria to the largest animal that still lives in the Great Lakes, lake sturgeon. The Great Lakes’ watershed supports organisms from every kingdom on Earth. The Great Lakes ecosystem provides habitat for terrestrial and aquatic species.
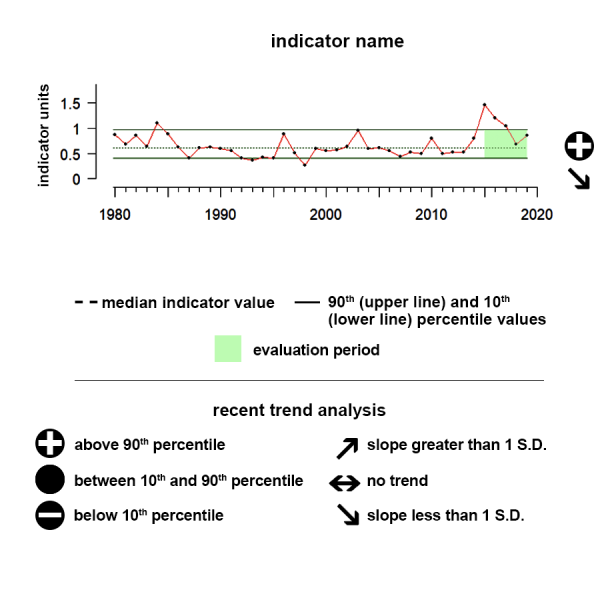
Understanding the Time series plots
Time series plots show the changes in each indicator as a function of time, over the period 1980-present. Each plot also shows horizontal lines that indicate the median (middle) value of that indicator, as well as the 10th and 90th percentiles, each calculated for the entire period of measurement. Time series plots were only developed for datasets with at least 10 years of data. Two symbols located to the right of each plot describe how recent values of an indicator compare against the overall series. A black circle indicates whether the indicator values over the last five years are on average above the series 90th percentile (plus sign), below the 10th percentile (minus sign), or between those two values (solid circle). Beneath that an arrow reflects the trend of the indicator over the last five years; an increase or decrease greater than one standard deviation is reflected in upward or downward arrows respectively, while a change of less than one standard deviation is recorded by a left-right arrow.
Great Lakes SST
During the last five years there has been no notable trend and values were between the 10th and 90th percentile of all observed data in the time series.
Sea surface temperature is defined as the average temperature of the top few millimeters of the ocean. Sea surface temperature monitoring tells us how the ocean and atmosphere interact, as well as providing fundamental data on the global climate system.
Data Interpretation:
Time series: The time series shows the integrated sea surface temperature across the Great Lakes. During the last five years there has been no notable trend and values were between the 10th and 90th percentile of all observed data in the time series.
Description of Sea Surface Temperature:
Sea surface temperature (SST) is defined as the temperature of the top few millimeters of the ocean. This temperature directly or indirectly impacts the rate of all physical, chemical, and most biological processes occurring in the ocean. SST is globally monitored by sensors on satellites, buoys, ships, ocean reference stations, autonomous underwater vehicles (AUVs) and other technologies.
SST monitoring tells us how the ocean and atmosphere interact, as well as providing fundamental data on the global climate system. This information also aids us in weather prediction, i.e. identifying the onset of El Niño and La Niña cycles - multiyear shifts in atmospheric pressure and wind speeds. These shifts affect ocean circulation, global weather patterns, and marine ecosystems. SST anomalies have been linked to shifting marine resources. With warming temperatures, we observe the poleward movements of fish and other species. Temperature extremes—both ocean heatwaves and cold spells—have been linked to coral bleaching as well as fishery and aquaculture mortality. We present the annual average SST in all regions.
Data:
Great Lakes SST data were accessed from (https://coastwatch.glerl.noaa.gov/glsea/glsea.html).
The data are plotted in degrees Celsius.
Great Lakes Heatwave Intensity
During the last five years there has been no trend and the five-year average is between the 10th and 90th percentiles of all observed data in the time series.
Values indicate cumulative annual heatwave intensity and duration in a region in degree-days
Description of Time Series: This time series shows the average integrated degree day value for the Great Lakes region. During the last five years there has been no trend and the five-year average is between the 10th and 90th percentiles of all observed data in the time series.
Indicator Source Information:
The marine heatwave data shown here are calculated by NOAA’s National Centers for Environmental Information using Optimum Interpolation Sea Surface Temperature (OISST) data. The NOAA 1/4° OISST is a long term Climate Data Record that incorporates observations from different platforms (satellites, ships, buoys and Argo floats) into a regular global grid. The dataset is interpolated to fill gaps on the grid and create a spatially complete map of sea surface temperature. Satellite and ship observations are referenced to buoys to compensate for platform differences and sensor biases.
Data Background and Caveats:
Heatwave metrics are calculated using OISST, a product that uses some forms of interpolation to fill data gaps. Heatwaves are defined by Hobday et al., 2016 as distinct events where SST anomaly reaches the 90th percentile in a pixel for at least 5 days, separated out by 3 or more days.
Great Lakes Heatwave Area
During the last five years there has been no trend and the five-year average is between the 10th and 90th percentiles of all observed data in the time series.
Values indicate monthly percent of an LME area affected by heatwave
Description of Time Series:
This time series shows the monthly heatwave spatial coverage for the Great Lakes Region. During the last five years there has been no trend and the five-year average is between the 10th and 90th percentiles of all observed data in the time series.
Indicator Source Information:
The marine heatwave data shown here are calculated by NOAA’s National Centers for Environmental Information using Optimum Interpolation Sea Surface Temperature (OISST) data. The NOAA 1/4° OISST is a long term Climate Data Record that incorporates observations from different platforms (satellites, ships, buoys and Argo floats) into a regular global grid. The dataset is interpolated to fill gaps on the grid and create a spatially complete map of sea surface temperature. Satellite and ship observations are referenced to buoys to compensate for platform differences and sensor biases.
Data Background and Caveats:
Heatwave metrics are calculated using OISST, a product that uses some forms of interpolation to fill data gaps. Heatwaves are defined by Hobday et al., 2016 as distinct events where SST anomaly reaches the 90th percentile in a pixel for at least 5 days, separated out by 3 or more days.
Great Lakes US Commercial Landings
Between 2010 and 2015, commercial landings from the Great Lakes were around historic levels, and there is no recent trend apparent.
Values correspond to landings in millions of metric tons
Commercial Landings Time Series
Between 2010 and 2015, commercial landings from the Great Lakes were around historic levels, and there is no recent trend apparent.
Extreme Gauge values:
A value of zero on the gauge means that the average revenue or landings over the last 5 years of data was below any annual value up until that point, while a value of 100 would indicate the average value over that same period was above any annual value up until that point.
Indicator Source Information:
Commercial fish catch data (called production) for the Great Lakes were published by the Great Lakes Fishery Commission in 1962 (Technical Report No.3) and covered the period 1867-1960. A supplement covering the years 1961-1968 was released in 1970, and a revised edition covering the years 1867-1977 was published in 1979. This third update of a web-based version covers the period 1867-2015
US Great Lakes Billion Dollar Disasters
The number of disasters over the past 5 years is substantially higher than historical levels of events, and there is an upward trend in the number of events.
Values correspond to the number of events in a given year
Time Series
The number of billion dollar disasters within the Great Lakes is variable over time. The number of disasters over the past 5 years is substantially higher than historical levels of events, and there is an upward trend in the number of events.
Indicator Source Information:
Billion dollar disaster event frequency data are taken from NOAA’s National Centers for Environmental Information. The number of disasters within each region were summed for every year of available data. Although the number is the count of unique disaster events within a region, the same disaster can impact multiple regions, meaning a sum across regions will overestimate the unique number of disasters.
Data Background and Caveats:
Events are included if they are estimated to cause more than one billion U.S. dollars in direct losses. The cost estimates of these events are adjusted for inflation using the Consumer Price Index (CPI) and are based on costs documented in several Federal and private-sector databases.
US Great Lakes Beach Closures
During the last five years, there has been no notable trend and values have remained within the 10th and 90th percentiles of all observed data in the time series.
Beach closures are the number of days when beach water quality is determined to be unsafe.
Data Interpretation:
Time series: This time series shows the average number of beach closure days in the Great Lakes from 2000 to 2024. During the last five years, there has been no notable trend and values have remained within the 10th and 90th percentiles of all observed data in the time series.
Indicator and source information:
Unsafe water quality may have significant impacts on human health, local economies, and the ecosystem. Beach water quality is determined by the concentration of bacteria in the water (either Enterococcus sp. or Escherichia coli).
The US Environmental Protection Agency (EPA) supports coastal states, counties and tribes in monitoring beach water quality, and notifying the public when beaches must be closed. The information presented is from states, counties, and tribes that submit data to the EPA Beach Program reporting database (BEACON). Data obtained from the EPA BEACON 2.0 website have been provided to EPA by the coastal and Great Lakes states, tribes and territories that receive grants under the BEACH Act. Data were refined to closure, by state or territory, by year.
Data background and limitations:
Data compiled by states or territories are combined in regions defined as US Large Marine Ecosystems (LME). Changes in the number of beach closure days may be driven by changes in the number of beaches monitored under the BEACH Act versus by state and local municipalities and not by changes in water and/or air quality. Not all US beach closures are captured in this database, because not all beaches in a state or territory are monitored through the EPA BEACH Act. Data that were not identified to a water body or identified as inland water were not included. Data for beaches monitored by state and local municipalities are not included.
Data from 2020 may be inflated by the Covid-19 pandemic, as there was no consistent way for states to report pandemic-related closures
Great Lakes Coastal Population
The 2017 – 2022 average coastal population in the Great Lakes was consistent with historic levels, and though there is a significant decreasing trend.
Values correspond to the total coastal population for a given region
Time Series
The 2017 – 2022 average coastal population in the Great Lakes was consistent with historic levels, and though there is a significant decreasing trend.
Indicator Source Information:
The American Community Survey (ACS) helps local officials, community leaders, and businesses understand the changes taking place in their communities. It is the premier source for detailed population and housing information about our nation.
Data Background and Caveats:
The values represented here are coastal county population estimates for states bordering US Large Marine Ecosystems as calculated by the US Census Bureau from the American Community Survey.

Resources
Great Lakes Ice Cover - GLERL
NOAA GLERL has been monitoring and documenting Great Lakes ice cover since the early 1970's using the ice products developed by the U.S. National Ice Center and the Canadian Ice Service. Research conducted on hydrometeorological processes and regional climate trends has led to models of lake thermal structure that play an integral role in ecosystem forecasting.

Great Lakes Water Levels - GLERL
Great Lakes water levels are continuously monitored by U.S. and Canadian federal agencies in the region through a binational partnership. NOAA GLERL relies on this water level data to conduct research on components of the regional water budget and to improve predictive models. Water level monitoring stations are operated by NOAA's Center for Operational Oceanographic Products and Services (CO-OPS) and the Department of Fisheries and Oceans' Canadian Hydrographic Service. The U.S. Army Corps of Engineers (Detroit, Chicago, Buffalo) and Environment and Climate Change Canada play crucial roles in research, coordination of data and operational seasonal water level forecasts for the basin.

Great Lakes Sea Surface Temperature - CoastWatch
CoastWatch is a nationwide National Oceanic and Atmospheric Administration (NOAA) program within which the Great Lakes Environmental Research Laboratory (GLERL) functions as the Great Lakes regional node. In this capacity, GLERL obtains, produces, and delivers environmental data and products for near real-time observation of the Great Lakes to support environmental science, decision making, and supporting research. This is achieved by providing access to near real-time and retrospective satellite observations and in-situ Great Lakes data. The goals and objectives of the CoastWatch Great Lakes Program directly support NOAA’s statutory responsibilities in estuarine and marine science living marine resource protection, and ecosystem monitoring and management.
Great Lakes Aquatic Non-Indigenous Species Information System (GLANSIS)
GLANSIS serves as the Laurentian Great Lakes' "one-stop shop" for information on aquatic nonindigenous species (ANS). The site provides the best available information to limit the introduction, spread, and impact of ANS in the Great Lakes by providing a comprehensive set of tools including species profiles, a custom-generated list of invaders, a mapping tool, risk assessments, and more. Learn more about the history of the GLANSIS program here.

ERMA-Great Lakes
The Environmental Response Management Application is a web-based Geographic Information System (GIS) tool that assists emergency responders and environmental resource managers in dealing with incidents that may adversely impact the environment.
NOAA Office of Coastal Management Great Lakes Facts
NOAA OCM's page for Fast Facts about the Great Lakes
US EPA & Environment and Climate Change Canada - State of the Great Lakes Reports
The Governments of Canada and the United States are pleased to release the State of the Great Lakes reports, which provide an overview of the status and trends of the Great Lakes ecosystem. Overall, Great Lakes water quality has recently been assessed as “fair and unchanging.” While progress to restore and protect the Great Lakes has occurred, including the reduction of toxic chemicals, challenges cited in the report include invasive species and excess nutrients that contribute to toxic and nuisance algae.
Pursuant to the Great Lakes Water Quality Agreement, Canada and the United States, together with their many partners, have established a suite of 9 indicators of ecosystem health to assess the state of the Great Lakes. The assessment is made based on indicators such as drinking water, fish consumption, and beach closures. Over 180 government and non-government Great Lakes scientists and other experts worked to assemble available data and prepare the reports.
Great Lakes-St. Lawrence River Adaptive Management Committee
The Great Lakes-St. Lawrence River Adaptive Management (GLAM) Committee will undertake the monitoring, modeling and assessment needed to support ongoing evaluation of the regulation of water levels and flows. The GLAM Committee will report to the Lake Superior Board of Control, Niagara Board of Control and Lake Ontario-St. Lawrence River Board.
The report of the Great Lakes-St. Lawrence River Task Team provided the basis for the GLAM Committee. Knowledge gained during the Lake Ontario-St. Lawrence River Study (2000-2006) and International Upper Great Lakes Study (2007-2012) will be updated and used by the GLAM Committee to provide ongoing information on how the regulation of water levels and flows affects socio-economic interests and the environment. As more is learned and as conditions change over time, this information will help determine whether changes to regulation should be considered.

The Great Lakes Water Quality Board
The Great Lakes Water Quality Board is the principal advisor to the International Joint Commission under the Great Lakes Water Quality Agreement. The Board assists the Commission by reviewing and assessing the progress of the governments of Canada and the United States in implementing the Agreement, identifying emerging issues and recommending strategies and approaches for preventing and resolving complex challenges facing the Great Lakes, and providing advice on the role of relevant jurisdictions to implement these strategies and approaches.

Thunder Bay National Marine Sanctuary Condition Report
This "condition report" provides a summary of resources in the Thunder Bay National Marine Sanctuary (sanctuary)1, pressures on those resources, current conditions and trends, and management responses to the pressures that threaten the integrity of sanctuary resources. Specifically, the document includes information on the status and trends of water quality, habitat, living resources and maritime archaeological resources, and the human activities that affect them. It presents responses to a set of questions posed to all sanctuaries (Appendix A). Resource status of Thunder Bay is rated on a scale from good to poor, and the timelines used for comparison vary from topic to topic. Trends in the status of resources are also reported, and are generally based on observed changes in status over the past five years, unless otherwise specified.

The Great Lakes Science Advisory Board
The Great Lakes Science Advisory Board provides advice on research to the International Joint Commission and to the Great Lakes Water Quality Board. It also provides advice on scientific matters referred to it by the Commission, or by the Great Lakes Water Quality Board in consultation with the Commission.
The Board conducts most of its work through its two standing Committees, the Science Priority Committee and the Research Coordination Committee.

Great Lakes Commission
The Great Lakes are an environmental and economic asset for the United States and Canada. The lakes fuel a $6 trillion regional economy and hold 90% of the U.S. supply of fresh surface water, providing drinking water for more than 40 million people. More than 1.5 million U.S. jobs are directly connected to the Great Lakes and those jobs generate $62 billion in wages annually.
To ensure that this vital resource is protected, the eight Great Lakes states created the Great Lakes Commission (GLC) in 1955 via the Great Lakes Basin Compact. In 1968, Congress provided its consent to the Compact and the interstate compact agency it created. The eight U.S. states and two Canadian provinces are represented on the nonpartisan GLC by a delegation of government-appointed commissioners.
The GLC recommends policies and practices to balance the use, development, and conservation of the water resources of the Great Lakes and brings the region together to work on issues that no single community, state, province, or nation can tackle alone.
The Great Lakes Fishery Commission
Canada and the United States share the Great Lakes fishery, a binational treasure worth more than $7 billion annually to the people of the two nations. The fishery attracts millions of anglers, supports valuable commercial and charter fishing, is a mainstay for native peoples, and is the very fabric of a healthy environment.
The Great Lakes Fishery Commission, operating through the 1954 Convention on Great Lakes Fisheries, today facilitates successful cross-border cooperation that ensures the two nations work together to improve and perpetuate this fishery.
While the lakes fall under the jurisdictions of two nations, eight states, one province, and several tribes, the fishery resources do not observe political boundaries. Canada and the United States recognized decades ago that the best way to manage and sustain the fishery is through continuous, binational cooperation.
Remarkably, a mechanism to collaborate across borders was not always present. Efforts to establish an international fishery commission for the Great Lakes failed repeatedly from the late 1800s to 1954 because of a poor understanding about how to work together and because the states and the province were unwilling to cede fishery management authority to a binational agency.
NSIDC Daily Great Lakes Ice Concentration
This data set consists of daily gridded lake ice concentration for the Laurentian Great Lakes from the NOAA Great Lakes Environmental Research Laboratory (GLERL). The data are provided as gridded ASCII text files along with corresponding browse image files in .jpg format.

International Joint Commission Water Quality
The Great Lakes Water Quality Agreement, first signed by Canada and the United States in 1972 and updated in 1978, 1987 and 2012, commits both countries to “restore and maintain the chemical, physical, and biological integrity of the Waters of the Great Lakes.” To achieve this, they will take specific, cooperative actions to resolve existing environmental problems and prevent potential issues, “recognizing the inherent natural value of the Great Lakes Basin Ecosystem, and guided by a shared vision of a healthy and prosperous Great Lakes region in which the Waters of the Great Lakes, through sound management, use and enjoyment, will benefit present and future generations of Canadians and Americans.”
Great Lakes Fishery Commision
The Great Lakes Fishery Commission was established in 1955 by the Canadian/U.S. Convention on Great Lakes Fisheries. The commission coordinates fisheries research, controls the invasive sea lamprey, and facilitates cooperative fishery management among the state, provincial, tribal, and federal agencies.
Great Lakes Indian Fish & Wildlife Commission (GLIFWC)
The Great Lakes Indian Fish & Wildlife Commission is commonly known by its acronym, GLIFWC. Formed in 1984, GLIFWC represents eleven Ojibwe tribes in Minnesota, Wisconsin, and Michigan who reserved hunting, fishing and gathering rights in the 1836, 1837, 1842, and 1854 Treaties with the United States government.
GLIFWC provides natural resource management expertise, conservation enforcement, legal and policy analysis, and public information services in support of the exercise of treaty rights during well-regulated, off-reservation seasons throughout the treaty ceded territories.
Lake Erie Harmful Algal Bloom Forecast
NOAA provides forecasts for seasonal blooms of cyanobacteria (blue-green algae) in Lake Erie, typically from July to October when warmer water creates favorable bloom conditions. Western Lake Erie has been plagued by an increase of HABs intensity over the past decade. These blooms consist of cyanobacteria or blue-green algae, which are capable of producing toxins that pose a risk to human and animal health, foul coastlines, and impact communities and businesses that depend on the lake.

St. Louis River Estuary Habitat Focus Area
The St. Louis River estuary runs along the western edge of Lake Superior on the border between Minnesota and Wisconsin. Situated between the urban areas of Duluth, Minnesota, and Superior, Wisconsin it is home to the country’s busiest and largest bulk inland port. Boasting unique wetland and wildlife habitats, the setting is often described as a wilderness in the heart of an urban area.

Muskegon Lake Habitat Focus Area
Muskegon Lake is a 4,232 acre drowned river mouth of the Muskegon River. Located on the west shoreline of Michigan’s Lower Peninsula, it is connected to Lake Michigan by an Army-Corps of Engineers-maintained deep-draft navigation channel. The lake provides important nursery habitat for Chinook salmon, largemouth and smallmouth bass, walleye, yellow perch, and threatened native species such as the lake sturgeon.

NOAA Digital Coast
The Digital Coast was developed to meet the unique needs of the coastal management community. The website provides not only coastal data, but also the tools, training, and information needed to make these data truly useful. Content comes from many sources, all of which are vetted by NOAA.
Data sets range from economic data to satellite imagery. The site contains visualization tools, predictive tools, and tools that make data easier to find and use. Training courses are available online or can be brought to the user’s location. Information is also organized by focus area or topic.
NOAA Great Lakes Region
The Great Lakes hold important environmental, cultural, and economic value for both the region and the nation.
NOAA is committed to providing critical tools and information to research, manage, and protect this vital resource. For more information about NOAA’s work in the Great Lakes region, check out the NOAA in the Great Lakes video.