Description of Sea Surface pCO2:
Carbon dioxide (CO2) released from fossil fuel burning and other human activities (also known as “anthropogenic CO2”) not only accumulates in Earth’s atmosphere, but is also absorbed by seawater at the ocean surface. This process represents a double-edged sword for the planet: CO2, which has negative consequences for climate change, is removed from the atmosphere but it also contributes to the acidification of ocean waters, which can harm sea life like corals and crabs. The partial pressure of CO2 in seawater (pCO2) represents the relative amount of CO2 in the water. It is a critical metric for calculating the exchange of CO2 across the air–sea interface and for tracking the effects of anthropogenic carbon on surface ocean chemistry.
Data Source:
Global observations of pCO2 from automated shipboard systems that take in and analyze water while a vessel is moving are aggregated in the Surface Ocean CO2 Atlas (SOCAT; Bakker et al., 2016). These shipboard observations have been combined with data from available observational, model-based, and satellite products (e.g., sea-surface temperature, salinity, and wind speed) to create estimates of surface ocean pCO2 in U.S. Large Marine Ecosystems over multiple decades, using a technique known as machine learning (Sharp et al., 2024). The pCO2 data shown here as an ecosystem indicator of ocean acidification represent regional annual averages of these mapped estimates. Uncertainty in pCO2 is estimated from a data-based validation of the machine-learning algorithms for each Large Marine Ecosystem, scaled by the data coverage in a given month. The complete dataset is available here.
Description of Sea Surface pH:
Man-made (or “anthropogenic”) CO2 that is taken up by the ocean influences the chemistry of seawater, resulting in an increase in hydrogen ion concentration of the surface ocean (i.e. a decrease in surface ocean pH). pH can be viewed as a “master variable” in ocean chemistry, controlling acid-base balance in the sea. It is also a common way to quantify ocean acidification: average surface ocean pH has decreased by more than 0.1 units since the beginning of the industrial revolution (Jiang et al., 2023). pH in these figures is provided on the total scale, which includes the contribution both from free hydrogen ions and hydrogen sulfate.
Data Source:
Mapped estimates of surface-ocean pCO2 in U.S. Large Marine Ecosystems (LME’s) (Sharp et al., 2024), based on observations from the SOCAT database, have been paired with another key ocean-carbon variable called total alkalinity (TA), estimated from salinity, temperature, and spatial information using algorithms called ESPERs (Carter et al., 2021), to calculate surface ocean pH across the U.S. LME’s. The pH data shown here as an ecosystem indicator of ocean acidification represent regional annual averages of these estimates. Uncertainty in pH is determined by propagating pCO2 and TA uncertainties through calculations, using reasonable estimates of uncertainty in required chemical constants and ancillary variables. The complete dataset is available here.
Description of Sea Surface Ωar:
Many marine animals and plants build shells or other hard parts from the minerals aragonite and calcite, which are forms of the chemical compound calcium carbonate. The chemical building blocks of these minerals are calcium and carbonate ions, which are common constituents of seawater. However, one effect of ocean acidification is to reduce the carbonate ion concentration in seawater, making it more difficult for these minerals to form. The chemical expression that describes the tendency of these minerals to form at equilibrium is called the saturation state of that mineral: higher values support mineral formation, while lower values inhibit mineral formation, or even promote the dissolution of these minerals. We present here saturation-state estimates for the mineral aragonite (Ωar), which is used by many marine organisms including corals, mollusks, and some zooplankton to create hard parts. At 20°C, saturation state of the mineral calcite is about 50% higher than aragonite (Mucci, 1983)
Data Source:
Mapped estimates of surface-ocean pCO2 in U.S. Large Marine Ecosystems (LME’s) (Sharp et al., 2024), based on observations from the SOCAT database, have been paired with another key ocean-carbon variable called total alkalinity (TA), estimated from salinity, temperature, and spatial information using algorithms called ESPERs (Carter et al., 2021), to calculate surface-ocean Ωar across the U.S. LME’s. The Ωar data shown here as an ecosystem indicator of ocean acidification represent regional averages of these estimates. Uncertainty in Ωar is determined by propagating pCO2 and TA uncertainties through calculations, using reasonable estimates of uncertainty in required chemical constants and ancillary variables. The complete dataset is available here.
More information about the methods can be found here.
For the most up to date data, please reference the original source above.
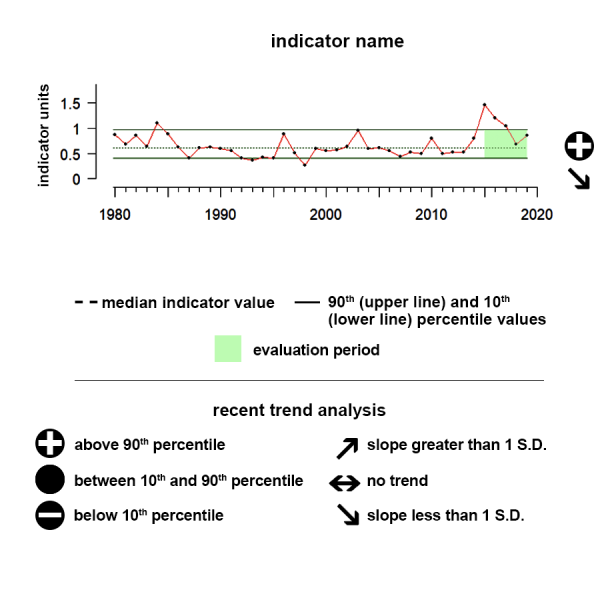
Understanding the Time series plots
Time series plots show the changes in each indicator as a function of time, over the period 1980-present. Each plot also shows horizontal lines that indicate the median (middle) value of that indicator, as well as the 10th and 90th percentiles, each calculated for the entire period of measurement. Time series plots were only developed for datasets with at least 10 years of data. Two symbols located to the right of each plot describe how recent values of an indicator compare against the overall series. A black circle indicates whether the indicator values over the last five years are on average above the series 90th percentile (plus sign), below the 10th percentile (minus sign), or between those two values (solid circle). Beneath that an arrow reflects the trend of the indicator over the last five years; an increase or decrease greater than one standard deviation is reflected in upward or downward arrows respectively, while a change of less than one standard deviation is recorded by a left-right arrow.
Aleutian Islands pCO2
Between 2019 and 2024 pCO2 showed a significant upward trend and was above the range of historical values.
The pCO2 data shown here as an ecosystem indicator of ocean acidification represent regional monthly averages of these mapped estimates.
Description of Time Series: Between 2019 and 2024 pCO2 showed a significant upward trend and was above the range of historical values.
Description of Sea Surface pCO2:
Carbon dioxide (CO2) released from fossil fuel burning and other human activities (also known as “anthropogenic CO2”) not only accumulates in Earth’s atmosphere, but is also absorbed by seawater at the ocean surface. This process represents a double-edged sword for the planet: CO2, which has negative consequences for climate change, is removed from the atmosphere but it also contributes to the acidification of ocean waters, which can harm sea life like corals and crabs. The partial pressure of CO2 in seawater (pCO2) represents the relative amount of CO2 in the water. It is a critical metric for calculating the exchange of CO2 across the air–sea interface and for tracking the effects of anthropogenic carbon on surface ocean chemistry.
Data Source:
Global observations of pCO2 from automated shipboard systems that take in and analyze water while a vessel is moving are aggregated in the Surface Ocean CO2 Atlas (SOCAT; Bakker et al., 2016). These shipboard observations have been combined with data from available observational, model-based, and satellite products (e.g., sea-surface temperature, salinity, and wind speed) to create estimates of surface ocean pCO2 in U.S. Large Marine Ecosystems over multiple decades, using a technique known as machine learning (Sharp et al., 2024). The pCO2 data shown here as an ecosystem indicator of ocean acidification represent regional annual averages of these mapped estimates. Uncertainty in pCO2 is estimated from a data-based validation of the machine-learning algorithms for each Large Marine Ecosystem, scaled by the data coverage in a given month. The complete dataset is available at https://www.ncei.noaa.gov/data/oceans/ncei/ocads/metadata/0287551.html.
Beaufort Sea pCO2
In the last 5 years, there has been no trend and data are similar to historical values
The pCO2 data shown here as an ecosystem indicator of ocean acidification represent regional monthly averages of these mapped estimates.
Description of Time Series: In the last 5 years, there has been no trend and data are similar to historical values
Description of Sea Surface pCO2:
Carbon dioxide (CO2) released from fossil fuel burning and other human activities (also known as “anthropogenic CO2”) not only accumulates in Earth’s atmosphere, but is also absorbed by seawater at the ocean surface. This process represents a double-edged sword for the planet: CO2, which has negative consequences for climate change, is removed from the atmosphere but it also contributes to the acidification of ocean waters, which can harm sea life like corals and crabs. The partial pressure of CO2 in seawater (pCO2) represents the relative amount of CO2 in the water. It is a critical metric for calculating the exchange of CO2 across the air–sea interface and for tracking the effects of anthropogenic carbon on surface ocean chemistry.
Data Source:
Global observations of pCO2 from automated shipboard systems that take in and analyze water while a vessel is moving are aggregated in the Surface Ocean CO2 Atlas (SOCAT; Bakker et al., 2016). These shipboard observations have been combined with data from available observational, model-based, and satellite products (e.g., sea-surface temperature, salinity, and wind speed) to create estimates of surface ocean pCO2 in U.S. Large Marine Ecosystems over multiple decades, using a technique known as machine learning (Sharp et al., 2024). The pCO2 data shown here as an ecosystem indicator of ocean acidification represent regional annual averages of these mapped estimates. Uncertainty in pCO2 is estimated from a data-based validation of the machine-learning algorithms for each Large Marine Ecosystem, scaled by the data coverage in a given month. The complete dataset is available at https://www.ncei.noaa.gov/data/oceans/ncei/ocads/metadata/0287551.html.
California Current pCO2
Between 2019 and 2024 in pCO2 showed a significant increasing trend and is at the upper range of historical values.
The pCO2 data shown here as an ecosystem indicator of ocean acidification represent regional monthly averages of these mapped estimates.
Description of Time Series: Between 2019 and 2024 in pCO2 showed a significant increasing trend and is at the upper range of historical values.
Description of Sea Surface pCO2:
Carbon dioxide (CO2) released from fossil fuel burning and other human activities (also known as “anthropogenic CO2”) not only accumulates in Earth’s atmosphere, but is also absorbed by seawater at the ocean surface. This process represents a double-edged sword for the planet: CO2, which has negative consequences for climate change, is removed from the atmosphere but it also contributes to the acidification of ocean waters, which can harm sea life like corals and crabs. The partial pressure of CO2 in seawater (pCO2) represents the relative amount of CO2 in the water. It is a critical metric for calculating the exchange of CO2 across the air–sea interface and for tracking the effects of anthropogenic carbon on surface ocean chemistry.
Data Source:
Global observations of pCO2 from automated shipboard systems that take in and analyze water while a vessel is moving are aggregated in the Surface Ocean CO2 Atlas (SOCAT; Bakker et al., 2016). These shipboard observations have been combined with data from available observational, model-based, and satellite products (e.g., sea-surface temperature, salinity, and wind speed) to create estimates of surface ocean pCO2 in U.S. Large Marine Ecosystems over multiple decades, using a technique known as machine learning (Sharp et al., 2024). The pCO2 data shown here as an ecosystem indicator of ocean acidification represent regional annual averages of these mapped estimates. Uncertainty in pCO2 is estimated from a data-based validation of the machine-learning algorithms for each Large Marine Ecosystem, scaled by the data coverage in a given month. The complete dataset is available at https://www.ncei.noaa.gov/data/oceans/ncei/ocads/metadata/0287551.html.
Close
Caribbean pCO2
Between 2019 and 2024 pCO2 showed an increasing trend but was mostly within the range of historical values.
The pCO2 data shown here as an ecosystem indicator of ocean acidification represent regional monthly averages of these mapped estimates.
Description of Time Series: Between 2019 and 2024 pCO2 showed an increasing trend but was mostly within the range of historical values.
Description of Sea Surface pCO2:
Carbon dioxide (CO2) released from fossil fuel burning and other human activities (also known as “anthropogenic CO2”) not only accumulates in Earth’s atmosphere, but is also absorbed by seawater at the ocean surface. This process represents a double-edged sword for the planet: CO2, which has negative consequences for climate change, is removed from the atmosphere but it also contributes to the acidification of ocean waters, which can harm sea life like corals and crabs. The partial pressure of CO2 in seawater (pCO2) represents the relative amount of CO2 in the water. It is a critical metric for calculating the exchange of CO2 across the air–sea interface and for tracking the effects of anthropogenic carbon on surface ocean chemistry.
Data Source:
Global observations of pCO2 from automated shipboard systems that take in and analyze water while a vessel is moving are aggregated in the Surface Ocean CO2 Atlas (SOCAT; Bakker et al., 2016). These shipboard observations have been combined with data from available observational, model-based, and satellite products (e.g., sea-surface temperature, salinity, and wind speed) to create estimates of surface ocean pCO2 in U.S. Large Marine Ecosystems over multiple decades, using a technique known as machine learning (Sharp et al., 2024). The pCO2 data shown here as an ecosystem indicator of ocean acidification represent regional annual averages of these mapped estimates. Uncertainty in pCO2 is estimated from a data-based validation of the machine-learning algorithms for each Large Marine Ecosystem, scaled by the data coverage in a given month. The complete dataset is available at https://www.ncei.noaa.gov/data/oceans/ncei/ocads/metadata/0287551.html.
Close
Eastern Bering Sea pCO2
Between 2019 and 2024 pCO2 showed a significant increasing trend and was above historical values.
The pCO2 data shown here as an ecosystem indicator of ocean acidification represent regional monthly averages of these mapped estimates.
Description of Time Series: Between 2019 and 2024 pCO2 showed a significant increasing trend and was above historical values.
Description of Sea Surface pCO2:
Carbon dioxide (CO2) released from fossil fuel burning and other human activities (also known as “anthropogenic CO2”) not only accumulates in Earth’s atmosphere, but is also absorbed by seawater at the ocean surface. This process represents a double-edged sword for the planet: CO2, which has negative consequences for climate change, is removed from the atmosphere but it also contributes to the acidification of ocean waters, which can harm sea life like corals and crabs. The partial pressure of CO2 in seawater (pCO2) represents the relative amount of CO2 in the water. It is a critical metric for calculating the exchange of CO2 across the air–sea interface and for tracking the effects of anthropogenic carbon on surface ocean chemistry.
Data Source:
Global observations of pCO2 from automated shipboard systems that take in and analyze water while a vessel is moving are aggregated in the Surface Ocean CO2 Atlas (SOCAT; Bakker et al., 2016). These shipboard observations have been combined with data from available observational, model-based, and satellite products (e.g., sea-surface temperature, salinity, and wind speed) to create estimates of surface ocean pCO2 in U.S. Large Marine Ecosystems over multiple decades, using a technique known as machine learning (Sharp et al., 2024). The pCO2 data shown here as an ecosystem indicator of ocean acidification represent regional annual averages of these mapped estimates. Uncertainty in pCO2 is estimated from a data-based validation of the machine-learning algorithms for each Large Marine Ecosystem, scaled by the data coverage in a given month. The complete dataset is available at https://www.ncei.noaa.gov/data/oceans/ncei/ocads/metadata/0287551.html.
Close
Gulf of Alaska pCO2
Between 2019 and 2024 pCO2 showed no significant trend and was above historical values.
The pCO2 data shown here as an ecosystem indicator of ocean acidification represent regional monthly averages of these mapped estimates.
Description of Time Series: Between 2019 and 2024 pCO2 showed no significant trend and was above historical values.
Description of Sea Surface pCO2:
Carbon dioxide (CO2) released from fossil fuel burning and other human activities (also known as “anthropogenic CO2”) not only accumulates in Earth’s atmosphere, but is also absorbed by seawater at the ocean surface. This process represents a double-edged sword for the planet: CO2, which has negative consequences for climate change, is removed from the atmosphere but it also contributes to the acidification of ocean waters, which can harm sea life like corals and crabs. The partial pressure of CO2 in seawater (pCO2) represents the relative amount of CO2 in the water. It is a critical metric for calculating the exchange of CO2 across the air–sea interface and for tracking the effects of anthropogenic carbon on surface ocean chemistry.
Data Source:
Global observations of pCO2 from automated shipboard systems that take in and analyze water while a vessel is moving are aggregated in the Surface Ocean CO2 Atlas (SOCAT; Bakker et al., 2016). These shipboard observations have been combined with data from available observational, model-based, and satellite products (e.g., sea-surface temperature, salinity, and wind speed) to create estimates of surface ocean pCO2 in U.S. Large Marine Ecosystems over multiple decades, using a technique known as machine learning (Sharp et al., 2024). The pCO2 data shown here as an ecosystem indicator of ocean acidification represent regional annual averages of these mapped estimates. Uncertainty in pCO2 is estimated from a data-based validation of the machine-learning algorithms for each Large Marine Ecosystem, scaled by the data coverage in a given month. The complete dataset is available at https://www.ncei.noaa.gov/data/oceans/ncei/ocads/metadata/0287551.html.
Gulf of America pCO2
Between 2019 and 2024 pCO2 showed a significant increasing trend and is at the upper range of historical values.
The pCO2 data shown here as an ecosystem indicator of ocean acidification represent regional monthly averages of these mapped estimates.
Description of Time Series: Between 2019 and 2024 pCO2 showed a significant increasing trend and is at the upper range of historical values.
Description of Sea Surface pCO2:
Carbon dioxide (CO2) released from fossil fuel burning and other human activities (also known as “anthropogenic CO2”) not only accumulates in Earth’s atmosphere, but is also absorbed by seawater at the ocean surface. This process represents a double-edged sword for the planet: CO2, which has negative consequences for climate change, is removed from the atmosphere but it also contributes to the acidification of ocean waters, which can harm sea life like corals and crabs. The partial pressure of CO2 in seawater (pCO2) represents the relative amount of CO2 in the water. It is a critical metric for calculating the exchange of CO2 across the air–sea interface and for tracking the effects of anthropogenic carbon on surface ocean chemistry.
Data Source:
Global observations of pCO2 from automated shipboard systems that take in and analyze water while a vessel is moving are aggregated in the Surface Ocean CO2 Atlas (SOCAT; Bakker et al., 2016). These shipboard observations have been combined with data from available observational, model-based, and satellite products (e.g., sea-surface temperature, salinity, and wind speed) to create estimates of surface ocean pCO2 in U.S. Large Marine Ecosystems over multiple decades, using a technique known as machine learning (Sharp et al., 2024). The pCO2 data shown here as an ecosystem indicator of ocean acidification represent regional annual averages of these mapped estimates. Uncertainty in pCO2 is estimated from a data-based validation of the machine-learning algorithms for each Large Marine Ecosystem, scaled by the data coverage in a given month. The complete dataset is available at https://www.ncei.noaa.gov/data/oceans/ncei/ocads/metadata/0287551.html.
Northern Bering and Chukchi Seas pCO2
In the last 5 years, there is no apparent trend and values are similar to historic values
The pCO2 data shown here as an ecosystem indicator of ocean acidification represent regional monthly averages of these mapped estimates.
Description of Time Series: In the last 5 years, there is no apparent trend and values are similar to historic values
Description of Sea Surface pCO2:
Carbon dioxide (CO2) released from fossil fuel burning and other human activities (also known as “anthropogenic CO2”) not only accumulates in Earth’s atmosphere, but is also absorbed by seawater at the ocean surface. This process represents a double-edged sword for the planet: CO2, which has negative consequences for climate change, is removed from the atmosphere but it also contributes to the acidification of ocean waters, which can harm sea life like corals and crabs. The partial pressure of CO2 in seawater (pCO2) represents the relative amount of CO2 in the water. It is a critical metric for calculating the exchange of CO2 across the air–sea interface and for tracking the effects of anthropogenic carbon on surface ocean chemistry.
Data Source:
Global observations of pCO2 from automated shipboard systems that take in and analyze water while a vessel is moving are aggregated in the Surface Ocean CO2 Atlas (SOCAT; Bakker et al., 2016). These shipboard observations have been combined with data from available observational, model-based, and satellite products (e.g., sea-surface temperature, salinity, and wind speed) to create estimates of surface ocean pCO2 in U.S. Large Marine Ecosystems over multiple decades, using a technique known as machine learning (Sharp et al., 2024). The pCO2 data shown here as an ecosystem indicator of ocean acidification represent regional annual averages of these mapped estimates. Uncertainty in pCO2 is estimated from a data-based validation of the machine-learning algorithms for each Large Marine Ecosystem, scaled by the data coverage in a given month. The complete dataset is available at https://www.ncei.noaa.gov/data/oceans/ncei/ocads/metadata/0287551.html.
Northeast pCO2
Between 2019 and 2024 pCO2 showed no trend and was mostly above the range of historical values to historical values.
The pCO2 data shown here as an ecosystem indicator of ocean acidification represent regional monthly averages of these mapped estimates.
Description of Time Series: Between 2019 and 2024 pCO2 showed no trend and was mostly above the range of historical values to historical values.
Description of Sea Surface pCO2:
Carbon dioxide (CO2) released from fossil fuel burning and other human activities (also known as “anthropogenic CO2”) not only accumulates in Earth’s atmosphere, but is also absorbed by seawater at the ocean surface. This process represents a double-edged sword for the planet: CO2, which has negative consequences for climate change, is removed from the atmosphere but it also contributes to the acidification of ocean waters, which can harm sea life like corals and crabs. The partial pressure of CO2 in seawater (pCO2) represents the relative amount of CO2 in the water. It is a critical metric for calculating the exchange of CO2 across the air–sea interface and for tracking the effects of anthropogenic carbon on surface ocean chemistry.
Data Source:
Global observations of pCO2 from automated shipboard systems that take in and analyze water while a vessel is moving are aggregated in the Surface Ocean CO2 Atlas (SOCAT; Bakker et al., 2016). These shipboard observations have been combined with data from available observational, model-based, and satellite products (e.g., sea-surface temperature, salinity, and wind speed) to create estimates of surface ocean pCO2 in U.S. Large Marine Ecosystems over multiple decades, using a technique known as machine learning (Sharp et al., 2024). The pCO2 data shown here as an ecosystem indicator of ocean acidification represent regional annual averages of these mapped estimates. Uncertainty in pCO2 is estimated from a data-based validation of the machine-learning algorithms for each Large Marine Ecosystem, scaled by the data coverage in a given month. The complete dataset is available at https://www.ncei.noaa.gov/data/oceans/ncei/ocads/metadata/0287551.html.
Pacific Islands pCO2
Between 2019 and 2024 pCO2 showed no trend and is in the range of historical values.
The pCO2 data shown here as an ecosystem indicator of ocean acidification represent regional monthly averages of these mapped estimates.
Description of Time Series: Between 2019 and 2024 pCO2 showed no trend and is in the range of historical values.
Description of Sea Surface pCO2:
Carbon dioxide (CO2) released from fossil fuel burning and other human activities (also known as “anthropogenic CO2”) not only accumulates in Earth’s atmosphere, but is also absorbed by seawater at the ocean surface. This process represents a double-edged sword for the planet: CO2, which has negative consequences for climate change, is removed from the atmosphere but it also contributes to the acidification of ocean waters, which can harm sea life like corals and crabs. The partial pressure of CO2 in seawater (pCO2) represents the relative amount of CO2 in the water. It is a critical metric for calculating the exchange of CO2 across the air–sea interface and for tracking the effects of anthropogenic carbon on surface ocean chemistry.
Data Source:
Global observations of pCO2 from automated shipboard systems that take in and analyze water while a vessel is moving are aggregated in the Surface Ocean CO2 Atlas (SOCAT; Bakker et al., 2016). These shipboard observations have been combined with data from available observational, model-based, and satellite products (e.g., sea-surface temperature, salinity, and wind speed) to create estimates of surface ocean pCO2 in U.S. Large Marine Ecosystems over multiple decades, using a technique known as machine learning (Sharp et al., 2024). The pCO2 data shown here as an ecosystem indicator of ocean acidification represent regional annual averages of these mapped estimates. Uncertainty in pCO2 is estimated from a data-based validation of the machine-learning algorithms for each Large Marine Ecosystem, scaled by the data coverage in a given month. The complete dataset is available at https://www.ncei.noaa.gov/data/oceans/ncei/ocads/metadata/0287551.html.
Close
Southeast pCO2
Between 2019 and 2024 pCO2 showed no trend but was near the top of the range of historical values.
The pCO2 data shown here as an ecosystem indicator of ocean acidification represent regional monthly averages of these mapped estimates.
Description of Time Series: Between 2019 and 2024 pCO2 showed no trend but was near the top of the range of historical values.
Description of Sea Surface pCO2:
Carbon dioxide (CO2) released from fossil fuel burning and other human activities (also known as “anthropogenic CO2”) not only accumulates in Earth’s atmosphere, but is also absorbed by seawater at the ocean surface. This process represents a double-edged sword for the planet: CO2, which has negative consequences for climate change, is removed from the atmosphere but it also contributes to the acidification of ocean waters, which can harm sea life like corals and crabs. The partial pressure of CO2 in seawater (pCO2) represents the relative amount of CO2 in the water. It is a critical metric for calculating the exchange of CO2 across the air–sea interface and for tracking the effects of anthropogenic carbon on surface ocean chemistry.
Data Source:
Global observations of pCO2 from automated shipboard systems that take in and analyze water while a vessel is moving are aggregated in the Surface Ocean CO2 Atlas (SOCAT; Bakker et al., 2016). These shipboard observations have been combined with data from available observational, model-based, and satellite products (e.g., sea-surface temperature, salinity, and wind speed) to create estimates of surface ocean pCO2 in U.S. Large Marine Ecosystems over multiple decades, using a technique known as machine learning (Sharp et al., 2024). The pCO2 data shown here as an ecosystem indicator of ocean acidification represent regional annual averages of these mapped estimates. Uncertainty in pCO2 is estimated from a data-based validation of the machine-learning algorithms for each Large Marine Ecosystem, scaled by the data coverage in a given month. The complete dataset is available at https://www.ncei.noaa.gov/data/oceans/ncei/ocads/metadata/0287551.html.
Close
Aleutian Islands pH
Between 2019 and 2024 pH showed a small downward trend and was below historical values.
The pH data shown here as an ecosystem indicator of ocean acidification represent regional monthly averages of these estimates.
Description of Time Series: Between 2019 and 2024 pH showed a small downward trend and was below historical values.
Description of Sea Surface pH:
Man-made (or “anthropogenic”) CO2 that is taken up by the ocean influences the chemistry of seawater, resulting in an increase in hydrogen ion concentration of the surface ocean (i.e. a decrease in surface ocean pH). pH can be viewed as a “master variable” in ocean chemistry, controlling acid-base balance in the sea. It is also a common way to quantify ocean acidification: average surface ocean pH has decreased by more than 0.1 units since the beginning of the industrial revolution (Jiang et al., 2023).
Data Source:
Mapped estimates of surface-ocean pCO2 in U.S. Large Marine Ecosystems (LME’s) (Sharp et al., 2024), based on observations from the SOCAT database, have been paired with another key ocean-carbon variable called total alkalinity (TA), estimated from salinity, temperature, and spatial information using algorithms called ESPERs (Carter et al., 2021), to calculate surface ocean pH across the U.S. LME’s. The pH data shown here as an ecosystem indicator of ocean acidification represent regional annual averages of these estimates. Uncertainty in pH is determined by propagating pCO2 and TA uncertainties through calculations, using reasonable estimates of uncertainty in required chemical constants and ancillary variables. The complete dataset is available at https://www.ncei.noaa.gov/data/oceans/ncei/ocads/metadata/0287551.html.
Beaufort Sea pH
In the last 5 years, there has been no trend and values are similar to historical limits
The pH data shown here as an ecosystem indicator of ocean acidification represent regional monthly averages of these estimates.
Description of Time Series: In the last 5 years, there has been no trend and values are similar to historical limits
Description of Sea Surface pH:
Man-made (or “anthropogenic”) CO2 that is taken up by the ocean influences the chemistry of seawater, resulting in an increase in hydrogen ion concentration of the surface ocean (i.e. a decrease in surface ocean pH). pH can be viewed as a “master variable” in ocean chemistry, controlling acid-base balance in the sea. It is also a common way to quantify ocean acidification: average surface ocean pH has decreased by more than 0.1 units since the beginning of the industrial revolution (Jiang et al., 2023).
Data Source:
Mapped estimates of surface-ocean pCO2 in U.S. Large Marine Ecosystems (LME’s) (Sharp et al., 2024), based on observations from the SOCAT database, have been paired with another key ocean-carbon variable called total alkalinity (TA), estimated from salinity, temperature, and spatial information using algorithms called ESPERs (Carter et al., 2021), to calculate surface ocean pH across the U.S. LME’s. The pH data shown here as an ecosystem indicator of ocean acidification represent regional annual averages of these estimates. Uncertainty in pH is determined by propagating pCO2 and TA uncertainties through calculations, using reasonable estimates of uncertainty in required chemical constants and ancillary variables. The complete dataset is available at https://www.ncei.noaa.gov/data/oceans/ncei/ocads/metadata/0287551.html.
California Current pH
Between 2019 and 2024 pH showed a significant decreasing trend and is at the lower end of the range of historical values.
The pH data shown here as an ecosystem indicator of ocean acidification represent regional monthly averages of these estimates.
Description of Time Series: Between 2019 and 2024 pH showed a significant decreasing trend and is at the lower end of the range of historical values.
Description of Sea Surface pH:
Man-made (or “anthropogenic”) CO2 that is taken up by the ocean influences the chemistry of seawater, resulting in an increase in hydrogen ion concentration of the surface ocean (i.e. a decrease in surface ocean pH). pH can be viewed as a “master variable” in ocean chemistry, controlling acid-base balance in the sea. It is also a common way to quantify ocean acidification: average surface ocean pH has decreased by more than 0.1 units since the beginning of the industrial revolution (Jiang et al., 2023).
Data Source:
Mapped estimates of surface-ocean pCO2 in U.S. Large Marine Ecosystems (LME’s) (Sharp et al., 2024), based on observations from the SOCAT database, have been paired with another key ocean-carbon variable called total alkalinity (TA), estimated from salinity, temperature, and spatial information using algorithms called ESPERs (Carter et al., 2021), to calculate surface ocean pH across the U.S. LME’s. The pH data shown here as an ecosystem indicator of ocean acidification represent regional annual averages of these estimates. Uncertainty in pH is determined by propagating pCO2 and TA uncertainties through calculations, using reasonable estimates of uncertainty in required chemical constants and ancillary variables. The complete dataset is available at https://www.ncei.noaa.gov/data/oceans/ncei/ocads/metadata/0287551.html.
Caribbean pH
Between 2019 and 2024 pH showed no significant trend and was similar to historical values.
The pH data shown here as an ecosystem indicator of ocean acidification represent regional monthly averages of these estimates.
Description of Time Series: Between 2019 and 2024 pH showed no significant trend and was similar to historical values.
Description of Sea Surface pH:
Man-made (or “anthropogenic”) CO2 that is taken up by the ocean influences the chemistry of seawater, resulting in an increase in hydrogen ion concentration of the surface ocean (i.e. a decrease in surface ocean pH). pH can be viewed as a “master variable” in ocean chemistry, controlling acid-base balance in the sea. It is also a common way to quantify ocean acidification: average surface ocean pH has decreased by more than 0.1 units since the beginning of the industrial revolution (Jiang et al., 2023).
Data Source:
Mapped estimates of surface-ocean pCO2 in U.S. Large Marine Ecosystems (LME’s) (Sharp et al., 2024), based on observations from the SOCAT database, have been paired with another key ocean-carbon variable called total alkalinity (TA), estimated from salinity, temperature, and spatial information using algorithms called ESPERs (Carter et al., 2021), to calculate surface ocean pH across the U.S. LME’s. The pH data shown here as an ecosystem indicator of ocean acidification represent regional annual averages of these estimates. Uncertainty in pH is determined by propagating pCO2 and TA uncertainties through calculations, using reasonable estimates of uncertainty in required chemical constants and ancillary variables. The complete dataset is available at https://www.ncei.noaa.gov/data/oceans/ncei/ocads/metadata/0287551.html.
Close
Eastern Bering Sea pH
Between 2019 and 2024 pH showed a significant decreasing trend and was below historical values.
The pH data shown here as an ecosystem indicator of ocean acidification represent regional monthly averages of these estimates.
Description of Time Series: Between 2019 and 2024 pH showed a significant decreasing trend and was below historical values.
Description of Sea Surface pH:
Man-made (or “anthropogenic”) CO2 that is taken up by the ocean influences the chemistry of seawater, resulting in an increase in hydrogen ion concentration of the surface ocean (i.e. a decrease in surface ocean pH). pH can be viewed as a “master variable” in ocean chemistry, controlling acid-base balance in the sea. It is also a common way to quantify ocean acidification: average surface ocean pH has decreased by more than 0.1 units since the beginning of the industrial revolution (Jiang et al., 2023).
Data Source:
Mapped estimates of surface-ocean pCO2 in U.S. Large Marine Ecosystems (LME’s) (Sharp et al., 2024), based on observations from the SOCAT database, have been paired with another key ocean-carbon variable called total alkalinity (TA), estimated from salinity, temperature, and spatial information using algorithms called ESPERs (Carter et al., 2021), to calculate surface ocean pH across the U.S. LME’s. The pH data shown here as an ecosystem indicator of ocean acidification represent regional annual averages of these estimates. Uncertainty in pH is determined by propagating pCO2 and TA uncertainties through calculations, using reasonable estimates of uncertainty in required chemical constants and ancillary variables. The complete dataset is available at https://www.ncei.noaa.gov/data/oceans/ncei/ocads/metadata/0287551.html.
Close
Gulf of Alaska pH
Between 2019 and 2024 pH showed no significant trend and was below historical values.
The pH data shown here as an ecosystem indicator of ocean acidification represent regional monthly averages of these estimates.
Description of Time Series: Between 2019 and 2024 pH showed no significant trend and was below historical values.
Description of Sea Surface pH:
Man-made (or “anthropogenic”) CO2 that is taken up by the ocean influences the chemistry of seawater, resulting in an increase in hydrogen ion concentration of the surface ocean (i.e. a decrease in surface ocean pH). pH can be viewed as a “master variable” in ocean chemistry, controlling acid-base balance in the sea. It is also a common way to quantify ocean acidification: average surface ocean pH has decreased by more than 0.1 units since the beginning of the industrial revolution (Jiang et al., 2023).
Data Source:
Mapped estimates of surface-ocean pCO2 in U.S. Large Marine Ecosystems (LME’s) (Sharp et al., 2024), based on observations from the SOCAT database, have been paired with another key ocean-carbon variable called total alkalinity (TA), estimated from salinity, temperature, and spatial information using algorithms called ESPERs (Carter et al., 2021), to calculate surface ocean pH across the U.S. LME’s. The pH data shown here as an ecosystem indicator of ocean acidification represent regional annual averages of these estimates. Uncertainty in pH is determined by propagating pCO2 and TA uncertainties through calculations, using reasonable estimates of uncertainty in required chemical constants and ancillary variables. The complete dataset is available at https://www.ncei.noaa.gov/data/oceans/ncei/ocads/metadata/0287551.html.
Gulf of America pH
Between 2019 and 2024 pH showed a significant decreasing trend and is now at the low end of the range of historical values.
The pH data shown here as an ecosystem indicator of ocean acidification represent regional annual averages of these estimates.
Description of Time Series: Between 2019 and 2024 pH showed a significant decreasing trend and is now at the low end of the range of historical values.
Description of Sea Surface pH:
Man-made (or “anthropogenic”) CO2 that is taken up by the ocean influences the chemistry of seawater, resulting in an increase in hydrogen ion concentration of the surface ocean (i.e. a decrease in surface ocean pH). pH can be viewed as a “master variable” in ocean chemistry, controlling acid-base balance in the sea. It is also a common way to quantify ocean acidification: average surface ocean pH has decreased by more than 0.1 units since the beginning of the industrial revolution (Jiang et al., 2023).
Data Source:
Mapped estimates of surface-ocean pCO2 in U.S. Large Marine Ecosystems (LME’s) (Sharp et al., 2024), based on observations from the SOCAT database, have been paired with another key ocean-carbon variable called total alkalinity (TA), estimated from salinity, temperature, and spatial information using algorithms called ESPERs (Carter et al., 2021), to calculate surface ocean pH across the U.S. LME’s. The pH data shown here as an ecosystem indicator of ocean acidification represent regional annual averages of these estimates. Uncertainty in pH is determined by propagating pCO2 and TA uncertainties through calculations, using reasonable estimates of uncertainty in required chemical constants and ancillary variables. The complete dataset is available at https://www.ncei.noaa.gov/data/oceans/ncei/ocads/metadata/0287551.html.
Close
Northern Bering and Chukchi Seas pH
In the last 5 years, values were similar to historical levels and showed no trend
The pH data shown here as an ecosystem indicator of ocean acidification represent regional monthly averages of these estimates.
Description of Time Series: In the last 5 years, values were similar to historical levels and showed no trend
Description of Sea Surface pH:
Man-made (or “anthropogenic”) CO2 that is taken up by the ocean influences the chemistry of seawater, resulting in an increase in hydrogen ion concentration of the surface ocean (i.e. a decrease in surface ocean pH). pH can be viewed as a “master variable” in ocean chemistry, controlling acid-base balance in the sea. It is also a common way to quantify ocean acidification: average surface ocean pH has decreased by more than 0.1 units since the beginning of the industrial revolution (Jiang et al., 2023).
Data Source:
Mapped estimates of surface-ocean pCO2 in U.S. Large Marine Ecosystems (LME’s) (Sharp et al., 2024), based on observations from the SOCAT database, have been paired with another key ocean-carbon variable called total alkalinity (TA), estimated from salinity, temperature, and spatial information using algorithms called ESPERs (Carter et al., 2021), to calculate surface ocean pH across the U.S. LME’s. The pH data shown here as an ecosystem indicator of ocean acidification represent regional annual averages of these estimates. Uncertainty in pH is determined by propagating pCO2 and TA uncertainties through calculations, using reasonable estimates of uncertainty in required chemical constants and ancillary variables. The complete dataset is available at https://www.ncei.noaa.gov/data/oceans/ncei/ocads/metadata/0287551.html.
Northeast pH
Between 2019 and 2024 pH showed no trend and was largely below the range of historical values.
The pH data shown here as an ecosystem indicator of ocean acidification represent regional monthly averages of these estimates.
Description of Time Series: Between 2019 and 2024 pH showed no trend and was largely below the range of historical values.
Description of Sea Surface pH:
Man-made (or “anthropogenic”) CO2 that is taken up by the ocean influences the chemistry of seawater, resulting in an increase in hydrogen ion concentration of the surface ocean (i.e. a decrease in surface ocean pH). pH can be viewed as a “master variable” in ocean chemistry, controlling acid-base balance in the sea. It is also a common way to quantify ocean acidification: average surface ocean pH has decreased by more than 0.1 units since the beginning of the industrial revolution (Jiang et al., 2023).
Data Source:
Mapped estimates of surface-ocean pCO2 in U.S. Large Marine Ecosystems (LME’s) (Sharp et al., 2024), based on observations from the SOCAT database, have been paired with another key ocean-carbon variable called total alkalinity (TA), estimated from salinity, temperature, and spatial information using algorithms called ESPERs (Carter et al., 2021), to calculate surface ocean pH across the U.S. LME’s. The pH data shown here as an ecosystem indicator of ocean acidification represent regional annual averages of these estimates. Uncertainty in pH is determined by propagating pCO2 and TA uncertainties through calculations, using reasonable estimates of uncertainty in required chemical constants and ancillary variables. The complete dataset is available at https://www.ncei.noaa.gov/data/oceans/ncei/ocads/metadata/0287551.html.
Pacific Islands pH
Between 2019 and 2024 pH showed no significant trend but was at the low end of the range of historical values.
The pH data shown here as an ecosystem indicator of ocean acidification represent regional monthly averages of these estimates.
Description of Time Series: Between 2019 and 2024 pH showed no significant trend but was at the low end of the range of historical values.
Description of Sea Surface pH:
Man-made (or “anthropogenic”) CO2 that is taken up by the ocean influences the chemistry of seawater, resulting in an increase in hydrogen ion concentration of the surface ocean (i.e. a decrease in surface ocean pH). pH can be viewed as a “master variable” in ocean chemistry, controlling acid-base balance in the sea. It is also a common way to quantify ocean acidification: average surface ocean pH has decreased by more than 0.1 units since the beginning of the industrial revolution (Jiang et al., 2023).
Data Source:
Mapped estimates of surface-ocean pCO2 in U.S. Large Marine Ecosystems (LME’s) (Sharp et al., 2024), based on observations from the SOCAT database, have been paired with another key ocean-carbon variable called total alkalinity (TA), estimated from salinity, temperature, and spatial information using algorithms called ESPERs (Carter et al., 2021), to calculate surface ocean pH across the U.S. LME’s. The pH data shown here as an ecosystem indicator of ocean acidification represent regional annual averages of these estimates. Uncertainty in pH is determined by propagating pCO2 and TA uncertainties through calculations, using reasonable estimates of uncertainty in required chemical constants and ancillary variables. The complete dataset is available at https://www.ncei.noaa.gov/data/oceans/ncei/ocads/metadata/0287551.html.
Southeast pH
Between 2019 and 2024 pH showed no significant trend and was below historical values.
The pH data shown here as an ecosystem indicator of ocean acidification represent regional monthly averages of these estimates.
Description of Time Series: Between 2019 and 2024 pH showed no significant trend and was below historical values.
Description of Sea Surface pH:
Man-made (or “anthropogenic”) CO2 that is taken up by the ocean influences the chemistry of seawater, resulting in an increase in hydrogen ion concentration of the surface ocean (i.e. a decrease in surface ocean pH). pH can be viewed as a “master variable” in ocean chemistry, controlling acid-base balance in the sea. It is also a common way to quantify ocean acidification: average surface ocean pH has decreased by more than 0.1 units since the beginning of the industrial revolution (Jiang et al., 2023).
Data Source:
Mapped estimates of surface-ocean pCO2 in U.S. Large Marine Ecosystems (LME’s) (Sharp et al., 2024), based on observations from the SOCAT database, have been paired with another key ocean-carbon variable called total alkalinity (TA), estimated from salinity, temperature, and spatial information using algorithms called ESPERs (Carter et al., 2021), to calculate surface ocean pH across the U.S. LME’s. The pH data shown here as an ecosystem indicator of ocean acidification represent regional annual averages of these estimates. Uncertainty in pH is determined by propagating pCO2 and TA uncertainties through calculations, using reasonable estimates of uncertainty in required chemical constants and ancillary variables. The complete dataset is available at https://www.ncei.noaa.gov/data/oceans/ncei/ocads/metadata/0287551.html.
Aleutian Islands Aragonite
Between 2019 and 2024 Sea Surface Ωar showed a significant decreasing trend and was lower than historical values.
The Ωar data shown here as an ecosystem indicator of ocean acidification represent regional averages of these estimates.
Description of Time Series: Between 2019 and 2024 Sea Surface Ωar showed a significant decreasing trend and was lower than historical values.
Description of Sea Surface Ωar:
Many marine animals and plants build shells or other hard parts from the minerals aragonite and calcite, which are forms of the chemical compound calcium carbonate. The chemical building blocks of these minerals are calcium and carbonate ions, which are common constituents of seawater. However, one effect of ocean acidification is to reduce the carbonate ion concentration in seawater, making it more difficult for these minerals to form. The chemical expression that describes the tendency of these minerals to form at equilibrium is called the saturation state of that mineral: higher values support mineral formation, while lower values inhibit mineral formation, or even promote the dissolution of these minerals. We present here saturation-state estimates for the mineral aragonite (Ωar), which is used by many marine organisms including corals, mollusks, and some zooplankton to create hard parts. At 20°C, saturation state of the mineral calcite is about 50% higher than aragonite (Mucci, 1983)
Data Source:
Mapped estimates of surface-ocean pCO2 in U.S. Large Marine Ecosystems (LME’s) (Sharp et al., 2024), based on observations from the SOCAT database, have been paired with another key ocean-carbon variable called total alkalinity (TA), estimated from salinity, temperature, and spatial information using algorithms called ESPERs (Carter et al., 2021), to calculate surface-ocean Ωar across the U.S. LME’s. The Ωar data shown here as an ecosystem indicator of ocean acidification represent regional averages of these estimates. Uncertainty in Ωar is determined by propagating pCO2 and TA uncertainties through calculations, using reasonable estimates of uncertainty in required chemical constants and ancillary variables. The complete dataset is available at https://www.ncei.noaa.gov/data/oceans/ncei/ocads/metadata/0287551.html.
Beaufort Sea Aragonite
Over the last 5 years, there is no trend apparent and values are within historical ranges
The Ωar data shown here as an ecosystem indicator of ocean acidification represent regional averages of these estimates.
Description of Time Series: Over the last 5 years, there is no trend apparent and values are within historical ranges
Description of Sea Surface Ωar:
Many marine animals and plants build shells or other hard parts from the minerals aragonite and calcite, which are forms of the chemical compound calcium carbonate. The chemical building blocks of these minerals are calcium and carbonate ions, which are common constituents of seawater. However, one effect of ocean acidification is to reduce the carbonate ion concentration in seawater, making it more difficult for these minerals to form. The chemical expression that describes the tendency of these minerals to form at equilibrium is called the saturation state of that mineral: higher values support mineral formation, while lower values inhibit mineral formation, or even promote the dissolution of these minerals. We present here saturation-state estimates for the mineral aragonite (Ωar), which is used by many marine organisms including corals, mollusks, and some zooplankton to create hard parts. At 20°C, saturation state of the mineral calcite is about 50% higher than aragonite (Mucci, 1983)
Data Source:
Mapped estimates of surface-ocean pCO2 in U.S. Large Marine Ecosystems (LME’s) (Sharp et al., 2024), based on observations from the SOCAT database, have been paired with another key ocean-carbon variable called total alkalinity (TA), estimated from salinity, temperature, and spatial information using algorithms called ESPERs (Carter et al., 2021), to calculate surface-ocean Ωar across the U.S. LME’s. The Ωar data shown here as an ecosystem indicator of ocean acidification represent regional averages of these estimates. Uncertainty in Ωar is determined by propagating pCO2 and TA uncertainties through calculations, using reasonable estimates of uncertainty in required chemical constants and ancillary variables. The complete dataset is available at https://www.ncei.noaa.gov/data/oceans/ncei/ocads/metadata/0287551.html.
California Current Aragonite
Between 2019 and 2024 Sea Surface Ωar showed a downward trend but was mostly within the range of historical values.
The Ωar data shown here as an ecosystem indicator of ocean acidification represent regional averages of these estimates.
Description of Time Series: Between 2019 and 2024 Sea Surface Ωar showed a downward trend but was mostly within the range of historical values.
Description of Sea Surface Ωar:
Many marine animals and plants build shells or other hard parts from the minerals aragonite and calcite, which are forms of the chemical compound calcium carbonate. The chemical building blocks of these minerals are calcium and carbonate ions, which are common constituents of seawater. However, one effect of ocean acidification is to reduce the carbonate ion concentration in seawater, making it more difficult for these minerals to form. The chemical expression that describes the tendency of these minerals to form at equilibrium is called the saturation state of that mineral: higher values support mineral formation, while lower values inhibit mineral formation, or even promote the dissolution of these minerals. We present here saturation-state estimates for the mineral aragonite (Ωar), which is used by many marine organisms including corals, mollusks, and some zooplankton to create hard parts. At 20°C, saturation state of the mineral calcite is about 50% higher than aragonite (Mucci, 1983)
Data Source:
Mapped estimates of surface-ocean pCO2 in U.S. Large Marine Ecosystems (LME’s) (Sharp et al., 2024), based on observations from the SOCAT database, have been paired with another key ocean-carbon variable called total alkalinity (TA), estimated from salinity, temperature, and spatial information using algorithms called ESPERs (Carter et al., 2021), to calculate surface-ocean Ωar across the U.S. LME’s. The Ωar data shown here as an ecosystem indicator of ocean acidification represent regional averages of these estimates. Uncertainty in Ωar is determined by propagating pCO2 and TA uncertainties through calculations, using reasonable estimates of uncertainty in required chemical constants and ancillary variables. The complete dataset is available at https://www.ncei.noaa.gov/data/oceans/ncei/ocads/metadata/0287551.html.
Caribbean Aragonite
Between 2019 and 2024 Sea Surface Ωar showed no trend and was mostly within the range of historical values.
The Ωar data shown here as an ecosystem indicator of ocean acidification represent regional averages of these estimates.
Description of Time Series: Between 2019 and 2024 Sea Surface Ωar showed no trend and was mostly within the range of historical values.
Description of Sea Surface Ωar:
Many marine animals and plants build shells or other hard parts from the minerals aragonite and calcite, which are forms of the chemical compound calcium carbonate. The chemical building blocks of these minerals are calcium and carbonate ions, which are common constituents of seawater. However, one effect of ocean acidification is to reduce the carbonate ion concentration in seawater, making it more difficult for these minerals to form. The chemical expression that describes the tendency of these minerals to form at equilibrium is called the saturation state of that mineral: higher values support mineral formation, while lower values inhibit mineral formation, or even promote the dissolution of these minerals. We present here saturation-state estimates for the mineral aragonite (Ωar), which is used by many marine organisms including corals, mollusks, and some zooplankton to create hard parts. At 20°C, saturation state of the mineral calcite is about 50% higher than aragonite (Mucci, 1983)
Data Source:
Mapped estimates of surface-ocean pCO2 in U.S. Large Marine Ecosystems (LME’s) (Sharp et al., 2024), based on observations from the SOCAT database, have been paired with another key ocean-carbon variable called total alkalinity (TA), estimated from salinity, temperature, and spatial information using algorithms called ESPERs (Carter et al., 2021), to calculate surface-ocean Ωar across the U.S. LME’s. The Ωar data shown here as an ecosystem indicator of ocean acidification represent regional averages of these estimates. Uncertainty in Ωar is determined by propagating pCO2 and TA uncertainties through calculations, using reasonable estimates of uncertainty in required chemical constants and ancillary variables. The complete dataset is available at https://www.ncei.noaa.gov/data/oceans/ncei/ocads/metadata/0287551.html.
Eastern Bering Sea Aragonite
Between 2019 and 2024 Sea Surface Ωar showed a significant decreasing trend and was similar to historical values.
The Ωar data shown here as an ecosystem indicator of ocean acidification represent regional averages of these estimates.
Description of Time Series: Between 2019 and 2024 Sea Surface Ωar showed a significant decreasing trend and was similar to historical values.
Description of Sea Surface Ωar:
Many marine animals and plants build shells or other hard parts from the minerals aragonite and calcite, which are forms of the chemical compound calcium carbonate. The chemical building blocks of these minerals are calcium and carbonate ions, which are common constituents of seawater. However, one effect of ocean acidification is to reduce the carbonate ion concentration in seawater, making it more difficult for these minerals to form. The chemical expression that describes the tendency of these minerals to form at equilibrium is called the saturation state of that mineral: higher values support mineral formation, while lower values inhibit mineral formation, or even promote the dissolution of these minerals. We present here saturation-state estimates for the mineral aragonite (Ωar), which is used by many marine organisms including corals, mollusks, and some zooplankton to create hard parts. At 20°C, saturation state of the mineral calcite is about 50% higher than aragonite (Mucci, 1983)
Data Source:
Mapped estimates of surface-ocean pCO2 in U.S. Large Marine Ecosystems (LME’s) (Sharp et al., 2024), based on observations from the SOCAT database, have been paired with another key ocean-carbon variable called total alkalinity (TA), estimated from salinity, temperature, and spatial information using algorithms called ESPERs (Carter et al., 2021), to calculate surface-ocean Ωar across the U.S. LME’s. The Ωar data shown here as an ecosystem indicator of ocean acidification represent regional averages of these estimates. Uncertainty in Ωar is determined by propagating pCO2 and TA uncertainties through calculations, using reasonable estimates of uncertainty in required chemical constants and ancillary variables. The complete dataset is available at https://www.ncei.noaa.gov/data/oceans/ncei/ocads/metadata/0287551.html.
Gulf of Alaska Aragonite
Between 2019 and 2024 Sea Surface Ωar showed a significant downward trend and was similar to historical values.
The Ωar data shown here as an ecosystem indicator of ocean acidification represent regional averages of these estimates.
Description of Time Series: Between 2019 and 2024 Sea Surface Ωar showed a significant downward trend and was similar to historical values.
Description of Sea Surface Ωar:
Many marine animals and plants build shells or other hard parts from the minerals aragonite and calcite, which are forms of the chemical compound calcium carbonate. The chemical building blocks of these minerals are calcium and carbonate ions, which are common constituents of seawater. However, one effect of ocean acidification is to reduce the carbonate ion concentration in seawater, making it more difficult for these minerals to form. The chemical expression that describes the tendency of these minerals to form at equilibrium is called the saturation state of that mineral: higher values support mineral formation, while lower values inhibit mineral formation, or even promote the dissolution of these minerals. We present here saturation-state estimates for the mineral aragonite (Ωar), which is used by many marine organisms including corals, mollusks, and some zooplankton to create hard parts. At 20°C, saturation state of the mineral calcite is about 50% higher than aragonite (Mucci, 1983)
Data Source:
Mapped estimates of surface-ocean pCO2 in U.S. Large Marine Ecosystems (LME’s) (Sharp et al., 2024), based on observations from the SOCAT database, have been paired with another key ocean-carbon variable called total alkalinity (TA), estimated from salinity, temperature, and spatial information using algorithms called ESPERs (Carter et al., 2021), to calculate surface-ocean Ωar across the U.S. LME’s. The Ωar data shown here as an ecosystem indicator of ocean acidification represent regional averages of these estimates. Uncertainty in Ωar is determined by propagating pCO2 and TA uncertainties through calculations, using reasonable estimates of uncertainty in required chemical constants and ancillary variables. The complete dataset is available at https://www.ncei.noaa.gov/data/oceans/ncei/ocads/metadata/0287551.html.
Gulf of America Aragonite Saturation
Between 2019 and 2024 Sea Surface Ωar showed a significant downward trend and was below the range of historical values.
The Ωar data shown here as an ecosystem indicator of ocean acidification represent regional averages of these estimates.
Description of Time Series: Between 2019 and 2024 Sea Surface Ωar showed a significant downward trend and was below the range of historical values.
Description of Sea Surface Ωar:
Many marine animals and plants build shells or other hard parts from the minerals aragonite and calcite, which are forms of the chemical compound calcium carbonate. The chemical building blocks of these minerals are calcium and carbonate ions, which are common constituents of seawater. However, one effect of ocean acidification is to reduce the carbonate ion concentration in seawater, making it more difficult for these minerals to form. The chemical expression that describes the tendency of these minerals to form at equilibrium is called the saturation state of that mineral: higher values support mineral formation, while lower values inhibit mineral formation, or even promote the dissolution of these minerals. We present here saturation-state estimates for the mineral aragonite (Ωar), which is used by many marine organisms including corals, mollusks, and some zooplankton to create hard parts. At 20°C, saturation state of the mineral calcite is about 50% higher than aragonite (Mucci, 1983)
Data Source:
Mapped estimates of surface-ocean pCO2 in U.S. Large Marine Ecosystems (LME’s) (Sharp et al., 2024), based on observations from the SOCAT database, have been paired with another key ocean-carbon variable called total alkalinity (TA), estimated from salinity, temperature, and spatial information using algorithms called ESPERs (Carter et al., 2021), to calculate surface-ocean Ωar across the U.S. LME’s. The Ωar data shown here as an ecosystem indicator of ocean acidification represent regional averages of these estimates. Uncertainty in Ωar is determined by propagating pCO2 and TA uncertainties through calculations, using reasonable estimates of uncertainty in required chemical constants and ancillary variables. The complete dataset is available at https://www.ncei.noaa.gov/data/oceans/ncei/ocads/metadata/0287551.html.
Northern Bering and Chukchi Seas Aragonite
Status and Trend Analysis is not appropriate for these Data
The Ωar data shown here as an ecosystem indicator of ocean acidification represent regional averages of these estimates.
Description of Time Series: Status and Trend Analysis is not appropriate for these Data
Description of Sea Surface Ωar:
Many marine animals and plants build shells or other hard parts from the minerals aragonite and calcite, which are forms of the chemical compound calcium carbonate. The chemical building blocks of these minerals are calcium and carbonate ions, which are common constituents of seawater. However, one effect of ocean acidification is to reduce the carbonate ion concentration in seawater, making it more difficult for these minerals to form. The chemical expression that describes the tendency of these minerals to form at equilibrium is called the saturation state of that mineral: higher values support mineral formation, while lower values inhibit mineral formation, or even promote the dissolution of these minerals. We present here saturation-state estimates for the mineral aragonite (Ωar), which is used by many marine organisms including corals, mollusks, and some zooplankton to create hard parts. At 20°C, saturation state of the mineral calcite is about 50% higher than aragonite (Mucci, 1983)
Data Source:
Mapped estimates of surface-ocean pCO2 in U.S. Large Marine Ecosystems (LME’s) (Sharp et al., 2024), based on observations from the SOCAT database, have been paired with another key ocean-carbon variable called total alkalinity (TA), estimated from salinity, temperature, and spatial information using algorithms called ESPERs (Carter et al., 2021), to calculate surface-ocean Ωar across the U.S. LME’s. The Ωar data shown here as an ecosystem indicator of ocean acidification represent regional averages of these estimates. Uncertainty in Ωar is determined by propagating pCO2 and TA uncertainties through calculations, using reasonable estimates of uncertainty in required chemical constants and ancillary variables. The complete dataset is available at https://www.ncei.noaa.gov/data/oceans/ncei/ocads/metadata/0287551.html.
Northeast Aragonite
Between 2019 and 2024 Sea Surface Ωar showed a significant downward trend and was similar to historical values.
The Ωar data shown here as an ecosystem indicator of ocean acidification represent regional averages of these estimates.
Description of Time Series: Between 2019 and 2024 Sea Surface Ωar showed a significant downward trend and was similar to historical values.
Description of Sea Surface Ωar:
Many marine animals and plants build shells or other hard parts from the minerals aragonite and calcite, which are forms of the chemical compound calcium carbonate. The chemical building blocks of these minerals are calcium and carbonate ions, which are common constituents of seawater. However, one effect of ocean acidification is to reduce the carbonate ion concentration in seawater, making it more difficult for these minerals to form. The chemical expression that describes the tendency of these minerals to form at equilibrium is called the saturation state of that mineral: higher values support mineral formation, while lower values inhibit mineral formation, or even promote the dissolution of these minerals. We present here saturation-state estimates for the mineral aragonite (Ωar), which is used by many marine organisms including corals, mollusks, and some zooplankton to create hard parts. At 20°C, saturation state of the mineral calcite is about 50% higher than aragonite (Mucci, 1983)
Data Source:
Mapped estimates of surface-ocean pCO2 in U.S. Large Marine Ecosystems (LME’s) (Sharp et al., 2024), based on observations from the SOCAT database, have been paired with another key ocean-carbon variable called total alkalinity (TA), estimated from salinity, temperature, and spatial information using algorithms called ESPERs (Carter et al., 2021), to calculate surface-ocean Ωar across the U.S. LME’s. The Ωar data shown here as an ecosystem indicator of ocean acidification represent regional averages of these estimates. Uncertainty in Ωar is determined by propagating pCO2 and TA uncertainties through calculations, using reasonable estimates of uncertainty in required chemical constants and ancillary variables. The complete dataset is available at https://www.ncei.noaa.gov/data/oceans/ncei/ocads/metadata/0287551.html.
Pacific Islands Aragonite
Between 2019 and 2024 Sea Surface Ωar showed no significant trend but was at the low end of the range of historical values.
The Ωar data shown here as an ecosystem indicator of ocean acidification represent regional averages of these estimates.
Description of Time Series: Between 2019 and 2024 Sea Surface Ωar showed no significant trend but was at the low end of the range of historical values.
Description of Sea Surface Ωar:
Many marine animals and plants build shells or other hard parts from the minerals aragonite and calcite, which are forms of the chemical compound calcium carbonate. The chemical building blocks of these minerals are calcium and carbonate ions, which are common constituents of seawater. However, one effect of ocean acidification is to reduce the carbonate ion concentration in seawater, making it more difficult for these minerals to form. The chemical expression that describes the tendency of these minerals to form at equilibrium is called the saturation state of that mineral: higher values support mineral formation, while lower values inhibit mineral formation, or even promote the dissolution of these minerals. We present here saturation-state estimates for the mineral aragonite (Ωar), which is used by many marine organisms including corals, mollusks, and some zooplankton to create hard parts. At 20°C, saturation state of the mineral calcite is about 50% higher than aragonite (Mucci, 1983)
Data Source:
Mapped estimates of surface-ocean pCO2 in U.S. Large Marine Ecosystems (LME’s) (Sharp et al., 2024), based on observations from the SOCAT database, have been paired with another key ocean-carbon variable called total alkalinity (TA), estimated from salinity, temperature, and spatial information using algorithms called ESPERs (Carter et al., 2021), to calculate surface-ocean Ωar across the U.S. LME’s. The Ωar data shown here as an ecosystem indicator of ocean acidification represent regional averages of these estimates. Uncertainty in Ωar is determined by propagating pCO2 and TA uncertainties through calculations, using reasonable estimates of uncertainty in required chemical constants and ancillary variables. The complete dataset is available at https://www.ncei.noaa.gov/data/oceans/ncei/ocads/metadata/0287551.html.
Southeast Aragonite
Between 2019 and 2024 Sea Surface Ωar showed a significant downward trend and was below historical values.
The Ωar data shown here as an ecosystem indicator of ocean acidification represent regional averages of these estimates.
Description of Time Series: Between 2019 and 2024 Sea Surface Ωar showed a significant downward trend and was below historical values.
Description of Sea Surface Ωar:
Many marine animals and plants build shells or other hard parts from the minerals aragonite and calcite, which are forms of the chemical compound calcium carbonate. The chemical building blocks of these minerals are calcium and carbonate ions, which are common constituents of seawater. However, one effect of ocean acidification is to reduce the carbonate ion concentration in seawater, making it more difficult for these minerals to form. The chemical expression that describes the tendency of these minerals to form at equilibrium is called the saturation state of that mineral: higher values support mineral formation, while lower values inhibit mineral formation, or even promote the dissolution of these minerals. We present here saturation-state estimates for the mineral aragonite (Ωar), which is used by many marine organisms including corals, mollusks, and some zooplankton to create hard parts. At 20°C, saturation state of the mineral calcite is about 50% higher than aragonite (Mucci, 1983)
Data Source:
Mapped estimates of surface-ocean pCO2 in U.S. Large Marine Ecosystems (LME’s) (Sharp et al., 2024), based on observations from the SOCAT database, have been paired with another key ocean-carbon variable called total alkalinity (TA), estimated from salinity, temperature, and spatial information using algorithms called ESPERs (Carter et al., 2021), to calculate surface-ocean Ωar across the U.S. LME’s. The Ωar data shown here as an ecosystem indicator of ocean acidification represent regional averages of these estimates. Uncertainty in Ωar is determined by propagating pCO2 and TA uncertainties through calculations, using reasonable estimates of uncertainty in required chemical constants and ancillary variables. The complete dataset is available at https://www.ncei.noaa.gov/data/oceans/ncei/ocads/metadata/0287551.html.

Resources
Ocean Acidification Program - NaMES Indicators
Marine ecosystems provide food, jobs, security, well-being, and other services to millions of people across the U.S. and they are facing increasingly complex challenges, including ocean acidification. Tracking the status and trends of these ecosystems is critically important to understand how they are changing and identify potential issues.
NOAA’s National Marine Ecosystem Status website provides snapshots of major marine and Great Lakes ecosystem indicators, capturing both the status and trends of eight U.S. ecosystem regions and overall national status. The ocean acidification indicator dashboard uses long-term ocean observing data to provide snapshots on ocean chemistry.

Surface Ocean CO2 Atlas
SOCAT version 2022, made public in 2022, includes data from more than 10 countries. It has 37.3 million quality controlled surface ocean fCO₂ measurements from 1957 to 2022, as well as calibrated sensor data. The SOCAT data set uses IOCCP recommended formats for metadata and data reporting. SOCAT quality control is carried out by regional working groups with a global group for coordination.

NOAA Ocean Acidification Program
NOAA’s Ocean Acidification Program seeks to better prepare society to respond to ocean acidification by expanding our understanding through research and interdisciplinary partnerships.
