Resource Links

Understanding the Time series plots
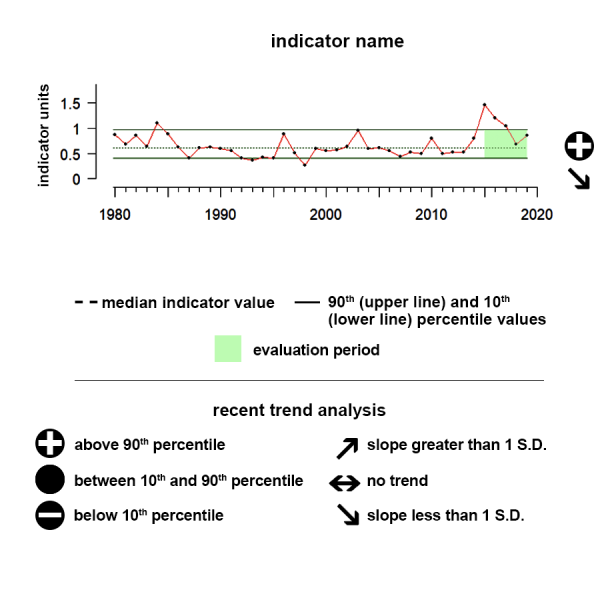
Time series plots show the changes in each indicator as a function of time, over the period 1980-present. Each plot also shows horizontal lines that indicate the median (middle) value of that indicator, as well as the 10th and 90th percentiles, each calculated for the entire period of measurement. Time series plots were only developed for datasets with at least 10 years of data. Two symbols located to the right of each plot describe how recent values of an indicator compare against the overall series. A black circle indicates whether the indicator values over the last five years are on average above the series 90th percentile (plus sign), below the 10th percentile (minus sign), or between those two values (solid circle). Beneath that an arrow reflects the trend of the indicator over the last five years; an increase or decrease greater than one standard deviation is reflected in upward or downward arrows respectively, while a change of less than one standard deviation is recorded by a left-right arrow.
- http://cdmo.baruch.sc.edu/
- https://oceanservice.noaa.gov/education/kits/estuaries/media/supp_estuar10d_disolvedox.html
- https://data.ioos.us/dataset?q=dissolved+oxygen
- https://portal.nnvl.noaa.gov/arcgis/home/item.html?id=1287fab34f064175a8739e349d1b374d
- https://www.nodc.noaa.gov/OC5/indprod.html
- NOAA Ocean Acidification Program: https://oceanacidification.noaa.gov/WhatWeDo/Monitoring.aspx
- GOOS Essential Ocean Variables: http://goosocean.org/index.php?option=com_content&view=article&id=14&Itemid=114
- GOOS Essential Ocean Variables: http://goosocean.org/index.php?option=com_content&view=article&id=14&Itemid=114
- Climate Change Indicators in the US (4th Edition): https://www.epa.gov/climate-indicators
- NOAA National Status & Trends Program Data Download Tool (DO, PH and other water quality)
- https://products.coastalscience.noaa.gov/nsandt_data/data.aspx
- NOAA Environmental Response Management Application (ERMA): Regional Portals
- https://response.restoration.noaa.gov/maps-and-spatial-data/environmental-response-management-application-erma
- NOAA Pytoplankton Monitoring Network (DO, PH and phytoplankton)
- https://ecowatch.ncddc.noaa.gov/erddap/tabledap/bedi_PMN.html